
“How many people have died in recent days from Covid-19 in English hospitals?” A simple enough question, but the issue of delayed reporting means the answer is riddled with uncertainty.
In “Covid-19 data: To age or not to age; to date or not to date?” we learned that of all “announced” daily deaths – the number of deaths centrally reported in a 24-hour period – less than one in four actually occurred in the day prior to the announcement. Most of these deaths in fact occurred more than 24 hours before the announcement. A second article, “Why England’s daily reported Covid-19 deaths are not the number of people that have died in a day”, discussed the reporting delay in more detail, shedding light on the “weekend effect” – where reporting slows down over the weekend due to comparatively lower levels of administrative staffing at hospital trusts, and delays in processing Covid-19 tests.
These issues clearly suggest that using announced daily deaths as the main indicator for the disease is misleading. We should instead focus on the death count that actually occurred, rather than that announced, on a particular day. For recent days, this is unknown due to reporting delays. For timely and reliable decision-making, using statistical modelling to estimate or “nowcast” death occurrence presents a compelling alternative.
A statistical model for correcting delayed reporting
Statistical models were publicly suggested more than a month ago as a tool for reporting daily Covid-19 deaths. The idea is to design a model that learns about the reporting delay from data on death counts, the date they occurred and the date they were reported. For England, this data can be constructed on a regional level from daily reports uploaded by NHS England. Nowcasting disease/death counts using modelling has been successfully adopted in Brazil for dengue fever cases and severe acute respiratory infection cases.1 Indeed, recent methodological advances mean statistical models for correcting delayed reporting are more potent than ever before.2,3
To understand these new approaches, let’s define the main quantities of interest, starting with y (t, r ), which represents the number of hospital deaths occurring on day t and in region r. For our analysis, we take y (t, r ) to be the total number of deaths reported within 14 days of occurrence (the “cut-off”). For deaths occurring less than 14 days ago, y (t, r ) is an unknown quantity to be predicted. We do, however, observe parts of y (t, r ) through the daily NHS England announcements, so we denote by z (t, r, d ) the number of deaths occurring on day t and in region r, but reported on day t + d (d > 0). These partial reports up to the 14-day cut-off sum to y (t, r ), so predicting any unknown z (t, r, d ) is the same task as predicting y (t, r ).
In our model,3 the time series of y (t, r ) and the reporting mechanism which transforms y (t, r ) into the partial reports z (t, r, d ) are implemented simultaneously using a layered approach. The first layer models y (t, r ) in each region, characterising the number of deaths with a smooth regionally-varying trend in time – to capture the shape of the overall regional epidemic curve – plus some regionally-varying noise. The second layer models how the total death count on a given day is split into partial reports z (t, r, d ) over the subsequent days/weeks. The delay behaviour varies considerably, but there is also considerable signal. This includes the aforementioned weekend effect, in addition to longer term structures that vary by region. The model can capture these (for each region) by characterising the cumulative proportion reported after each day of delay as a smooth trend in time, plus a time of week effect, plus some noise.3
Figure 1 illustrates these signals in the reporting delay, by plotting the estimated mean proportion of deaths reported within 2 days for each region and day of the week, with the smooth temporal trends frozen at 8 April (the apparent peak in English deaths) in the left panel and two weeks later in the right panel. Weekly cycles are evident for most regions – where more deaths occurring on a Wednesday are reported within 2 days than deaths occurring on a Saturday – but the strongest cycles occur in the South East, Midlands and East of England. In addition, at the peak of the outbreak, just over half of deaths were expected to be reported within 2 days in the East of England, London, the Midlands, the North West, and the South East. Two weeks later, the mean proportion reported had risen considerably, to around two-thirds. That said, there is no evidence here of a causal link between the high number of daily deaths around the peak and the more severe reporting delay in these regions.
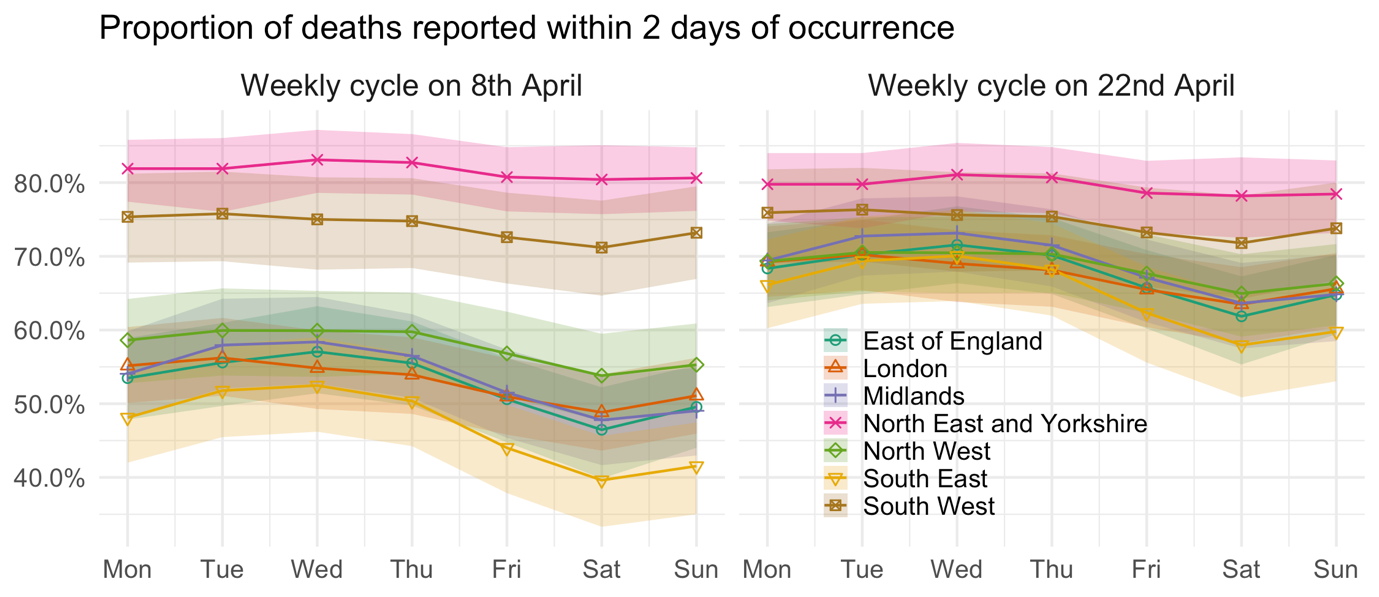
FIGURE 1 Estimated weekly cycle in the mean proportion of deaths reported within 2 days of occurrence, after temporal trends are taken into account and with 95% uncertainty intervals.
By taking all of these signals into account, the model can factor in recent trends in the daily fatality rate, recent reporting performance, and the time-of-week effect on the reporting delay, to make a reasonably accurate estimate of the number of deaths which actually occurred in recent days. Figure 2 shows estimated death counts from the model on data up to and including 5 May. The points show the total number of deaths reported on each day, and we can see that numbers drop steeply for the final few days leading up to 5 May, as reports at that time had not yet caught up to the real number of deaths. The lines are estimates (posterior median) of the total death count on each day, with the shaded areas representing 95% prediction intervals. These are interpreted as the values we predict the points to reach after 14 days of reporting. Deaths which occurred many days ago are mostly reported, reflected by the narrowness of prediction intervals. However, the uncertainty grows wider the closer we get to 5 May. If we extrapolate the temporal trends in the daily death rate, we can even make predictions of the death count for the days after 5 May.
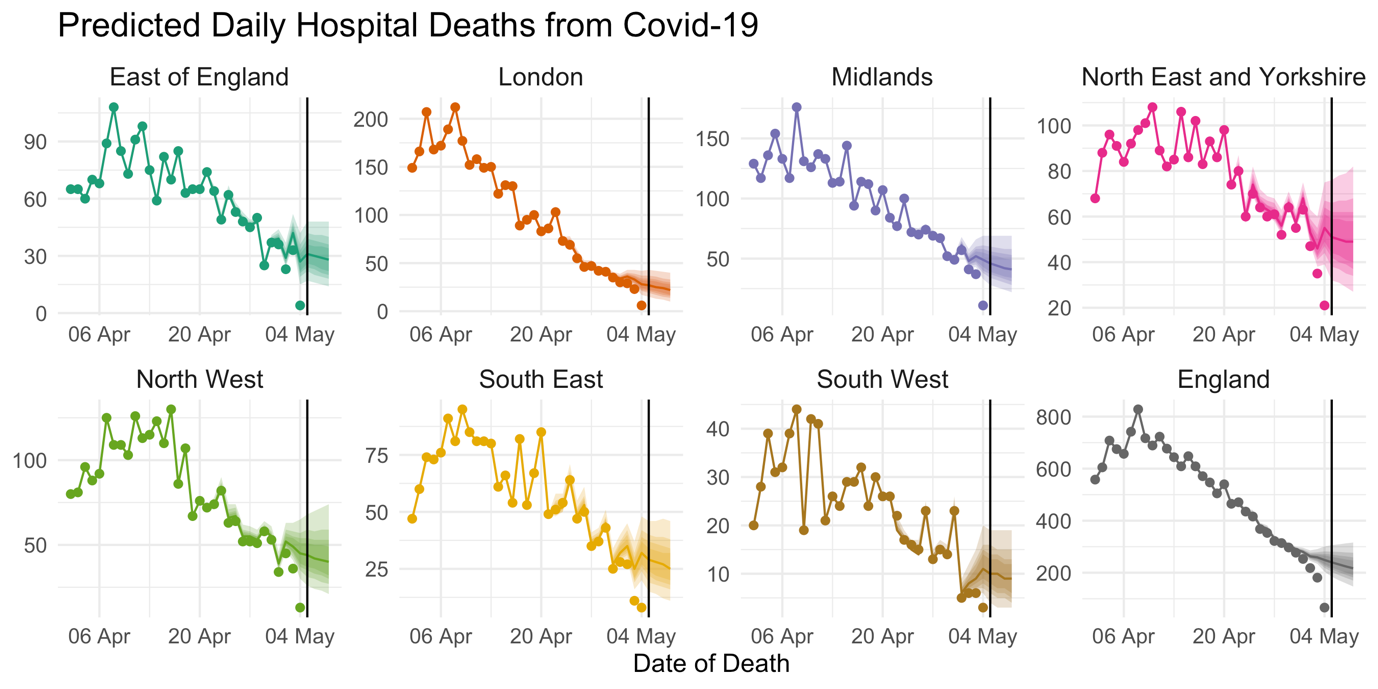
FIGURE 2 Points show the total reported number of hospital deaths from Covid-19 reported so far. Lines show the estimated number of deaths which actually occurred on each day and shaded areas represent 95% prediction intervals. Estimates for England are obtained by summation of posterior samples across regions.3
Instead of relying on the potentially misleading “announced” daily deaths, we should acknowledge the limitations of our reporting system. In adopting a modelling approach, the answer to our opening question, “How many people have died in recent days from Covid-19 in English hospitals?”, remains uncertain, but by arming ourselves with the right statistical tools, we can demystify this uncertainty for a more transparent and better-informed pandemic response.
Note
R code and data to implement the authors’ model and reproduce these results can be downloaded from here. Details on evaluation of model nowcasts and forecasts2 can be found here.
About the authors
Dr Oliver Stoner is a research fellow in the Institute for Data Science and Artificial Intelligence at the University of Exeter.
Dr Theo Economou is a lecturer in statistical science at the University of Exeter.
References
- Bastos, L. S., Economou, T., Gomes, M. F. C., et al. (2019) A modelling approach for correcting reporting delays in disease surveillance data. Statistics in Medicine, 38, 4363– 4377. ^
- Stoner, O. and Economou, T. (2019) Multivariate hierarchical frameworks for modeling delayed reporting in count data. Biometrics. ^
- Stoner, O. and Economou, T. (2019) A hierarchical modelling framework for correcting delayed reporting in spatio-temporal disease surveillance data. arXiv e-print. ^


