
Although I knew there were Catholic and Protestant communities in Belfast, I was surprised at the extent of segregation by religious background in the city. For the moment, I'm only looking at the working age population because I'll be interested in employment and health outcomes later. The 2001 census records roughly 81,650 people from Catholic backgrounds and 79,650 people from Protestant backgrounds of working age living in Belfast. Data is available from the census on the populations of areas at a range of scales including census output areas, which have an average population of roughly 330 people (n = 912), and super output areas which have an average population of slightly more than 1,800 people (n = 150). This data is available on the internet at the Northern Ireland Statistics & Research Agency's website.
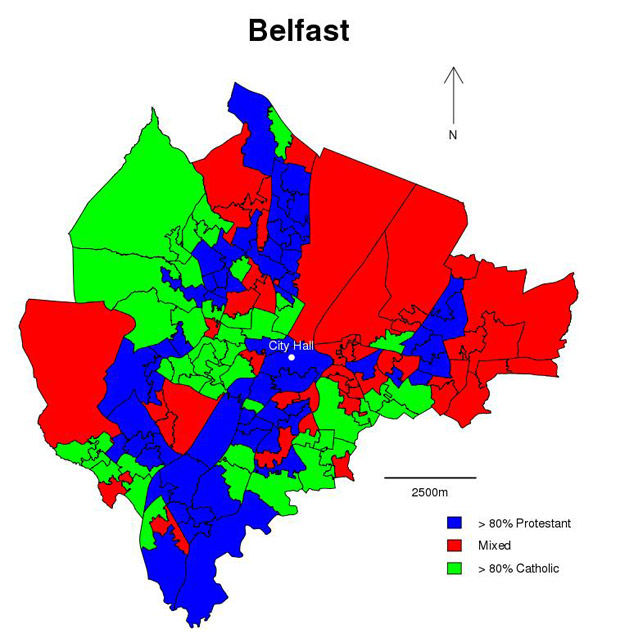
The figure below shows a map of the super output areas in Belfast with three types of area distinguished: those where people are predominantly (>80 percent) from Protestant backgrounds (n = 58), mixed communities where neither the Catholic or Protestant group makes up more than 80 percent of the population (n = 45) and those where people are predominantly (>80 percent) from Catholic backgrounds (n = 47). The map makes clear that the population is not evenly distributed across the city according to religious background with only about a third of the population living in mixed areas.
There is a large literature on the measurement of the residential segregation of different groups. The main dimension of segregation that has been used in research studies is evenness and, although a wide range of different indices have been proposed, the geographical evenness of a group is usually measured using the Index of Dissimilarity (D). This index runs from 0 to 1 and can be interpreted as measuring the proportion of the minority population that would have to move home to give an even distribution across local areas. This approach was initially developed to study the residential segregation of White and Black groups in American cities. There is no hard and fast rule for what a high level of D is but in the 2000 US census several metropolitan areas had values of D of over 0.80 including Chicago, New York and Detroit. These values can be interpreted to mean that over 80 percent of the black population in these cities would need to move between blocks to give an even black-white population mix over the metropolitan area.
Research studies have examined whether there are comparable levels of residential segregation in English cities. The answer seems to be that in general there aren't but there are still concentrations of ethnic minorities, however, that suggest there are pressures (or informal rules) operating to concentrate particular groups in particular areas. For example, one third of the Bangladeshi population in England live in Tower Hamlets. Yes, okay, people like to live with people like themselves but the London Borough of Tower Hamlets seems like an odd place to choose to have a party (letters to the Editor, please, not to me).
Looking at Belfast, I used the 2001 census data to calculate a value of D for Catholic – Protestant segregation for each super output area. At first the results seemed surprising as the average value of D was around 0.03 suggesting that there is very little Catholic-Protestant segregation. Looking at the distribution of different religious backgrounds across the city makes clear why this is the case. The map above shows that the geographical scale at which segregation takes place is significantly wider than the super output area with relatively large areas of the city being dominated by either Catholic or Protestant groups. So all I've shown is that within each of the 150 super output areas the population seems to be fairly evenly distributed by religious background even though in many areas there are only a few people from Catholic or Protestant backgrounds. I was using the wrong geographical scale. If we calculate D for Belfast as a whole using the super output area populations (n = 150) the picture is slightly different, with a value of D of 0.68, significantly higher than the average value for local areas within the city.
In the social sciences, social relationships are often seen as a source of resources on which people can draw. From this perspective living in an area with a large number of people from a similar background may have benefits. Social relationships can also work, however, to exclude people from different backgrounds and if you belonged to a minority in a segregated area your ability to draw on resources in the community might not be so great. Although this data is cross-sectional and at the ecological (and not individual level) let's next go on and see if we can say anything about the relationship between segregation and the health and employment outcomes of different groups.


