A few weeks ago ('Is social segregation rising across English universities?') we looked at how the proportion of university entrants from local areas with low rates of participation in higher education has varied over the last several years for different institutions in England and Wales. The results showed that universities are quite strongly stratified according to the characteristics of entrants. In the following, we'll look at how the characteristics of students help to distinguish universities which have different entrance requirements.
We'll briefly look at how universities can be classified into groups using the level of qualifications of entrants and then we'll use a discriminant analysis to find combinations of student characteristics which distinguish the different groups. The results show that the social characteristics of entrants discriminate institutions reasonably well. In some cases institutions are not classified in the correct category, however, but these are themselves useful in understanding why institutions vary.
In the UK, young people apply to go to university through UCAS, the University and Colleges Admissions Service. The most direct way to classify universities uses the tariff score or the number of points UCAS award young people on the basis of their qualifications (not to be confused with the points you get for shopping in Tesco). For example, a student gets 140 points for an A* grade at A level, 120 points for an A grade, 100 points for a B grade etc. Numerous websites and publications use the average point score of entrants to assign universities into broad groups and in the following I'll use a four-fold classification which splits universities into those which have entrants with the highest, high, medium and lowest tariff scores. To give an idea of the variation across institutions, the average number of points that a student needs to get into Cambridge or Oxford is over 500, the equivalent of at least 4 A's at A level (or a large family shopping in Tesco) while 200 points are enough to get into some of the less prestigious institutions. The classification is not an indicator of the quality of different universities but it is an indicator of their prestige (or how impressed people might be when you tell them where you got you degree from). In order to examine how well the characteristics of a university's intake distinguish institutions in the different groups I have used the proportions of entrants with the following five characteristics: a)from areas with low participation in education, b) aged 21 or under, c) from low social class backgrounds or d) who attended a state school plus e) the dropout rate in the first year.
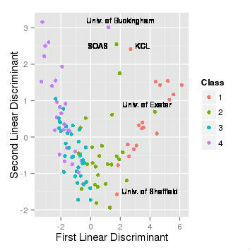
Previously we have looked at the relationship between the characteristics of entrants and the institutions they go to using simple plots; however, even with only five characteristics it would be useful to have a method of finding the combinations of characteristics which distinguish different institutions. For example, to get into Oxford, do you have to be rich, highly intelligent, privately-educated, good at sport and aristocratic, or is just one or two of those – say, being highly intelligent and privately-educated – enough? Or, less flippantly, do the less-prestigious universities take their entry predominantly from those aged under-21 who come from los social class backgrounds – or is each less-prestigious university significantly different in its intake? In order to find combinations of the characteristics of entrants which distinguish institutions with different entrance requirements I have used a discriminant analysis. Discriminant analysis looks for the combination of characteristics that separates institutions in the different groups as well as possible. The first combination of characteristics provides the best overall discrimination between groups, the second combination the second best discrimination after accounting for the first combination, and so on. The figure below plots the values of the first and second linear discriminant for each institution and shows that the discriminant functions do clearly distinguish institutions in different categories. The first linear discriminant is particularly effective in discriminating between institutions with different entrance requirements. The figure shows that the universities with the highest entrance requirements (the red dots) plot together having the highest values of the first linear discriminant and those with the lowest entrance requirements (the lilac dots) also plot together but have the lowest values of the first linear discriminant. SOAS is the School of Oriental and African Studies in London; KCL is Kings College, London.
In a few cases the social characteristics of entrants are such, however, that the discriminant analysis assigns the institution to an incorrect category. For example, entrants to the University of Exeter (green dot) have social characteristics which would suggest that it should be among the universities with the highest entrance requirements, but actualy its entraance requiremnts are only in the 'high' category; and entrants to the University of Buckingham have social characteristics typical of universities with high tariff scores (group 2) but it is actually among the universities with the lowest entrance requirements (group 4). The University of Buckingham is interesting because it is the only private university in England and the freedom that it has to set its own entrance requirements and fees would seem to provide an explanation for the distinctive characteristic of its intake. In a private institution, being able to pay the costs and accept the risks of university might have a greater significance than they do in the state system, while entrance qualifications are less important in determining admissions – crudely, if you can afford to pay they may well be happy to accept you. It could be argued that the University of Buckingham gives an indication of how higher education might change if market forces are allowed to play a greater role in admissions policies in the state sector.


