
Social media is a place for people to share their feelings, concerns, questions, and opinions. This is as true during the Covid-19 pandemic as it has been at any other time since Twitter, Facebook and other similar services came into existence. But the things people talk about during the pandemic are likely to be different to what they talk about in normal times. After all, at various points throughout 2020, people have been forced to stay at home in the interests of public health, schools have temporarily closed, family and friends have been kept apart, and many individuals have lost their jobs or sources of income.
In our Wireless to Cloud Computing research lab at the Missouri University of Science and Technology, USA, we started collecting and analysing Covid-19-related messages (or “tweets”) shared on Twitter, beginning March 2020. We collated US-only tweets with the aim of tracking the topics of interests and people’s sentiments across the United States. We developed a web application, CoronaVis, which processes the collected tweets in real-time and produces interactive graphs and charts displaying the popular topics and different behaviors of individuals across the states. The website is accessible publicly and enables anyone to observe sentiments, emotions, topic trends, and user mobility, with interactive visualizations including maps, time charts, and word clouds.
In this article, we describe our primary work on detecting and analysing the emotions that people convey through their tweets. Text in all different forms is often analysed by researchers and classified according to high-level sentiments, such as whether a word or phrase is neutral, positive, or negative. However, within each of these high-level categories are a range of different emotions: a passage of text classified as negative may in fact reflect the author’s sadness, or their fears, or their anger, and each of these specific emotions might lead a person to behave or make decisions in a very different way. So, instead of labeling high-level sentiments, in our analysis of Covid-19 tweets we labeled fine-grained emotions, including feelings of optimism, happiness, sadness, surprise, fear, anger, denial, pessimism, jokiness, and neutrality.
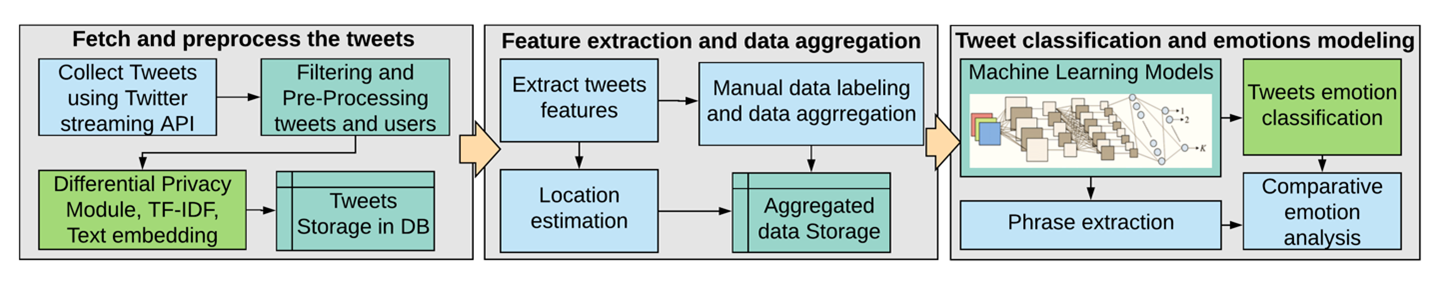
Figure 1: Overview of our approach to detect and analyze emotions using tweets.
Approach
Since 5 March 2020, we have collected more than 200 million Covid-19 related tweets from US-based users of Twitter. We processed these tweets to filter out the noise and irreverent tweets, removed symbols and generated necessary features. We filtered tweets using keywords like COVID, and Corona appearing as a string or substring. We also handled the variations in those keywords including lower-case, upper-case, hashtags, and combined words such as COVID-19, Covid19, COVID19, SARS-COVID_Virus, SARs_Cov-2, Coronavirus, etc. Finally, we selected those tweets for which we could estimate their state-level locations. If location information was not directly available in the tweet as a geo-tag, we fetched the user profile to check whether location information was available and further processed the state from that information. We discarded tweets if we were unable to infer any location information.
Although there is some ongoing research on emotion detection and classification, there is a lack of publicly available, labeled emotion data sets, partly also as there were no such crises at the level of the Covid-19 pandemic in the recent past. We did find three useful data sets with emotion labels (crowdflower, SemEval-2018 Task 1, and SenWave). However, the emotion labels are different across the data sets, and the number of annotated tweets for many labels is very low. So, we decided to label our own tweet emotion data set of about 10,000 tweets and aggregate our data with those three data sets. Finally, we developed two different machine learning models: one for identifying emotions in tweets, and another for extracting phrases from the tweets that are responsible for conveying emotions.
Emotion detection and extraction
We developed a deep neural network to identify the emotions in tweets. The idea of emotion detection is similar to text classification, which is the process of assigning a category to a text based on the content or context in the text. Here we assign an emotion as a category to the tweets based on the content.
To train the model, we used our data set of labelled tweets. From these tweets, the model extracted a set of features and learned what might be the emotion of a tweet based on the words and the relation among the words. After that training, we provided new tweets as inputs and asked the model to provide the emotion categories for those tweets. We used an 80/20 split ratio for training and testing. After aggregating the external data sets with our annotated data, the total number of data points for each emotion varied from 10,000-25,000 for different emotion labels. We used 80% of the data points for training and validation, and 20% of the data points were used as an unseen new set to test the model.
For each tweet, the model produces a label of 0 or 1 for each of our emotion categories, where 1 means that the tweet is exhibiting the respective emotion. The table below contains two example tweets created by us for demonstration purposes, showing just four of our emotion categories. The full list of categories is:
- optimistic
- happy
- sad
- surprise
- fear
- anger
- denial
- pessimistic
- joking
- neutral
Table 1: Sample output of the emotion classifier model.
| Tweet text | Optimistic | Happy | Pessimistic | Sad |
| Relief provided to the poor needy people during lockdown to reduce the hurdle during COVID-19. | 1 | 1 | 0 | 0 |
| Under lockdown for months… COVID is not going anywhere soon! | 0 | 0 | 1 | 1 |
As we did for emotion detection, we developed another machine learning model for extracting the phrases from tweets that are responsible for a given emotion. Again, the model is trained on a set of manually annotated tweets, where phrases from the tweets are already selected against the emotions. The model automatically tries to learn the dominant words or phrases in the tweets related to different emotions. Based on this learning, the model then determines phrases for emotions contained in new tweets and yields those phrases as outputs. Table 2 demonstrates the output of the phrase extractor for our two sample tweets.
Table 2: Sample output of Phrase extraction model.
| Tweet text | Emotion category | Extracted phrase |
| Relief provided to the poor needy people during lockdown to reduce the hurdle during COVID-19. | Optimistic | relief provided |
| Under lockdown for months… COVID is not going anywhere soon! | Pessimistic | covid is not going anywhere |
Technical notes
We modified the deep neural network that we have developed in our previous research work to classify the emotions in tweets. The model architecture contains primarily Bidirectional Long-Short Term Memory (BiLSTM), attention, and auxiliary features layers along with text embedding and dense layer. We evaluate the model in terms of F1-score, Accuracy, and Jaccard score. We can define the metrics as follows. Let, TP, TN, FP, and FN be the true positive, true negative, false positive, and false negative, respectively. True positive and true negative denote the count of the data points for which the classification model was able to predict the expected emotion label. For instance, if a tweet has a label as “optimistic” and the model also predicts that tweet as “optimistic” then it yields a true positive. On the other hand, if a tweet has not been labeled as “optimistic” and the model also predicts that tweet as not “optimistic” then this is a true negative scenario. If the model predicts the opposite of the expected labeled emotion, such as “optimistic” for a non-optimistic tweet or vice-versa, then it is counted as a false positive or false negative prediction. We can define:
- Precision = (TP + FP) / TP
- Recall = (TP + FN) / TP
- F1-score = (2 x Precision x Recall) / (Precision + Recall)
- Accuracy = (TP + TN) / (TP + TN + FP + FN)
Further, we developed a phrase extraction model from the tweet text using RoBERTa – a Robustly Optimized BERT with a custom head. We have used the pretrained RoBERTa base model which uses BERT-base architecture with 125M parameters. RoBERTa and BERT both employ a language masking strategy where the model learns to predict the sequence of the text from a larger unannotated text. To illustrate, let’s say that, for a given tweet, we want to know the phrase that reflects optimism. We provide the tweet text to the model and ask it to find the phrase. The model predicts a short text sequence from the tweet which we consider as the extracted phrase for the emotion. We used the Jaccard similarity score to evaluate the performance of the phrase extractor. This is essentially measuring the string match between the extracted phrase by the model and the selected text by the human annotator for the tweets. The Jaccard similarity index compared the characters of the two strings to see which characters are shared and which are distinct in the sequential order.
For phrase or text prediction, the Jaccard similarity score can be calculated as follows. In the equation, |T| is the total number of tweets where 1 to T denotes the index of the tweets in the test data, Yk denotes the ground truth string, Pk refers to the predicted string:
Our classification model achieves a combined accuracy of over 85% for the detection of different emotions. The phrase extraction model yields a Jaccard similarity score of 0.78.
Emotion analysis
Using our collected tweets and the approach described above, we analyze emotions across the USA and within six individual states, New York (NY), California (CA), Colorado (CO), Texas (TX), Missouri (MO), and Florida (FL), to perform a comparative study.
We started our analysis with 10 emotions. However, we found that we had limited data for “denial” and “joking”, so we decided to discard these from our analysis. Figure 2 presents the weekly ratio of eight emotion categories labeled as optimistic, happy, sad, fear, pessimistic, anger, surprise, and “others” for the US as a whole. The “others” category includes the tweets which might fall into the categories of neutral, denial, and joking. From the figure we can see that optimistic, happy, sad, fear, pessimistic, and anger are the dominant labels. The proportion of tweets with label “surprise” is very low, so – as with denial and joking – we decided to discard surprise and concentrate on the six dominant emotions.
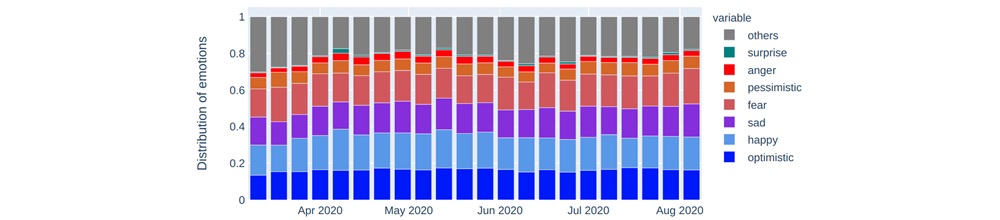
Figure 2: Weekly emotion distribution in the USA (5 March to 7 August 2020).
Figure 3 provides a good overview of the emotion variations over time. We can see a rise in the anger and sad labels from April to May. This might be related to the increasing number of infections, job losses, and Covid-19-related deaths, etc. However, optimistic and happy also show an upward trend in the same period, and this might relate to the economic stimulus package that was announced, the possibility of more medical supplies (e.g., testing, masks, sanitizer), positive vaccine news, and other developments. Fear seems to decline from April to June, however, it begins to tick up again after June, perhaps due to the increasing numbers of infections in big states such as Texas and Florida.
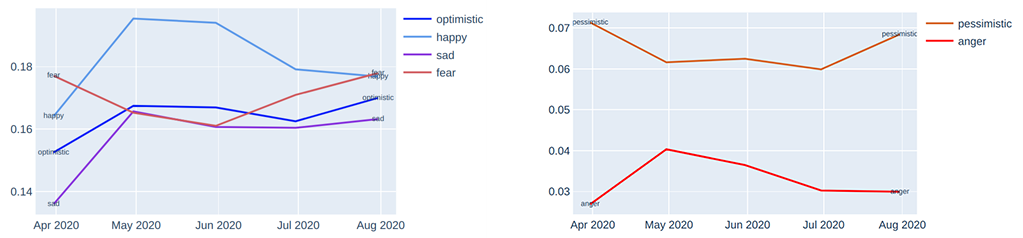
Figure 3: Monthly emotion variation in the USA (March-August 2020). Y-axis represents the respective emotion distribution on a scale of 0-1.
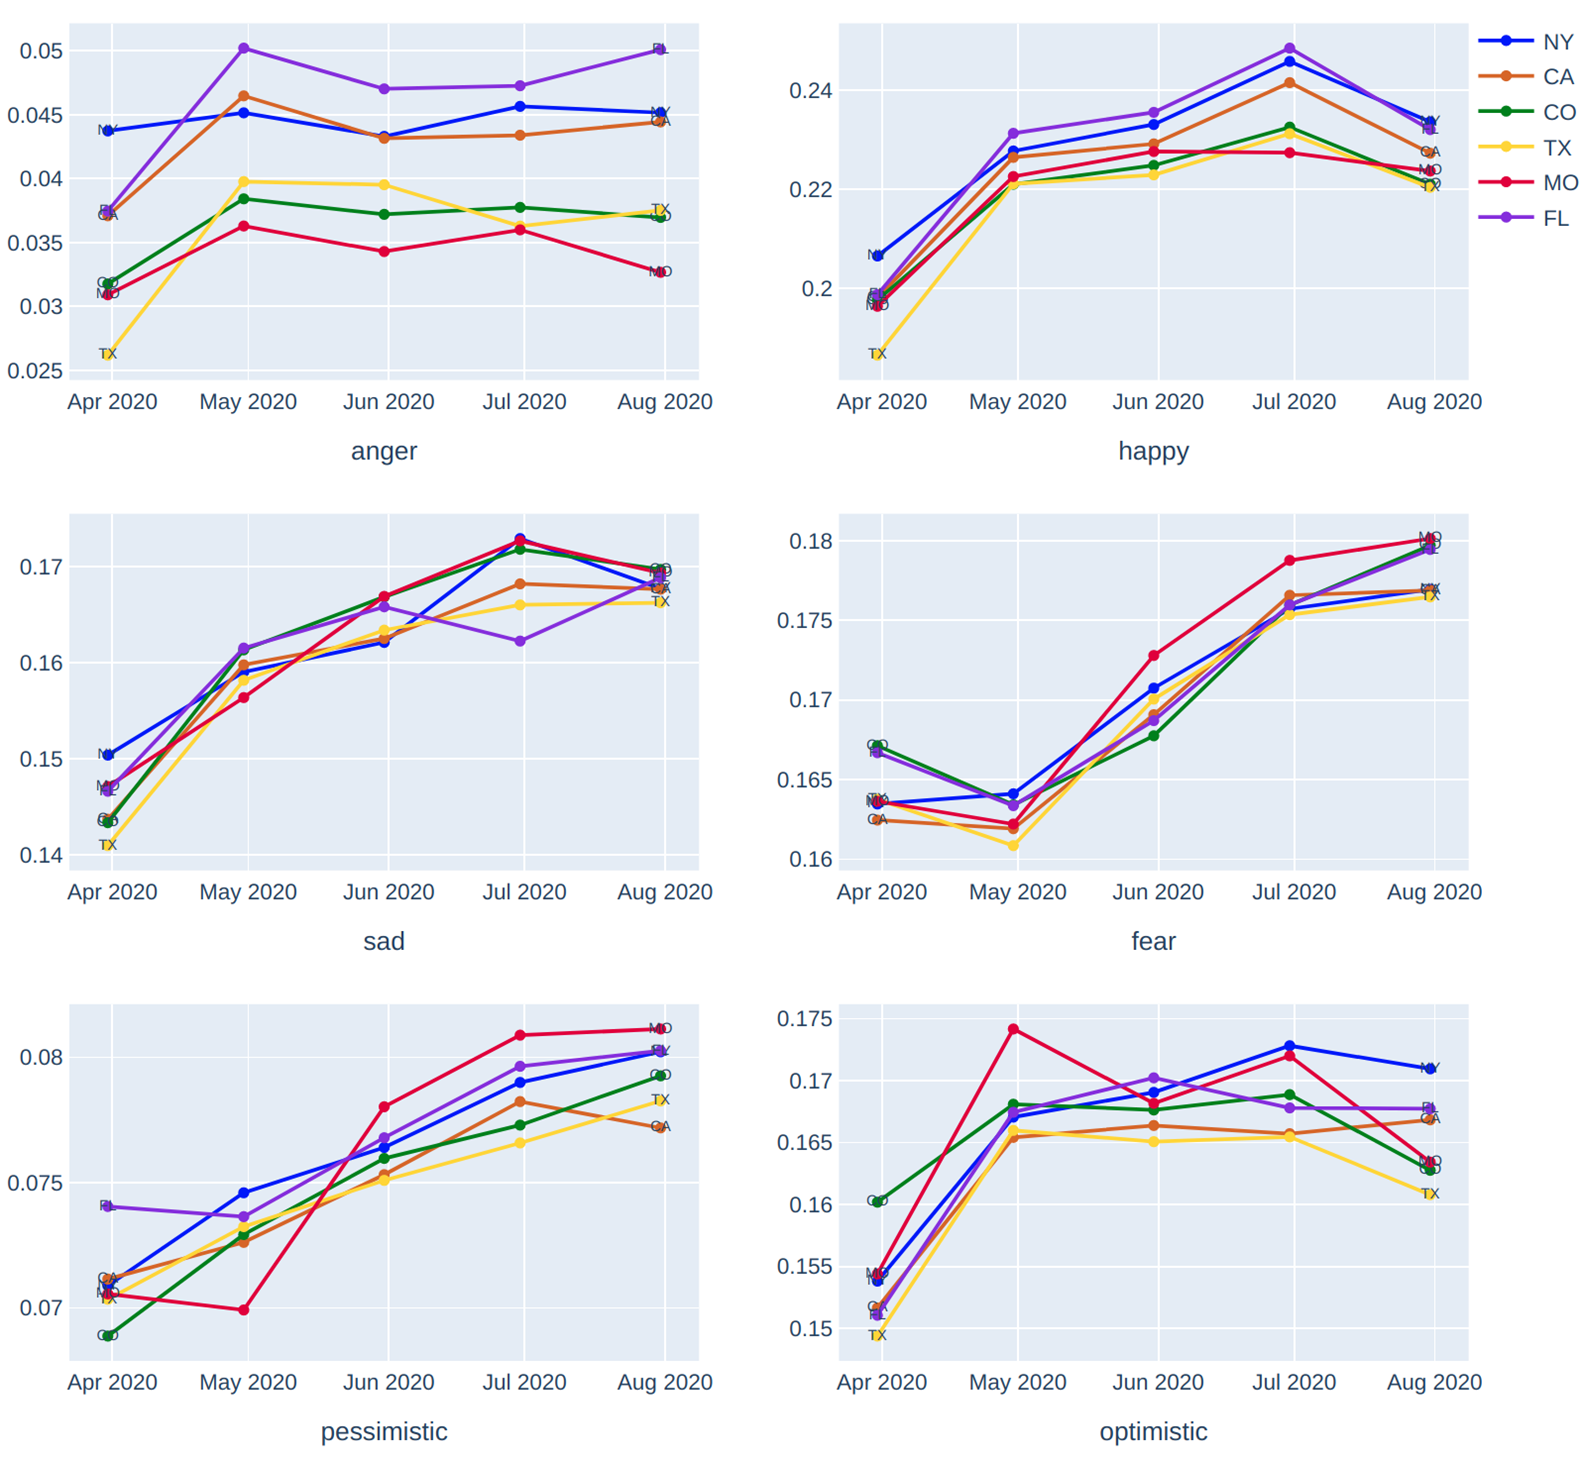
Figure 4: Monthly emotion analysis in 6 states of USA (March-August 2020). Y-axis represents the respective emotion distribution on a scale of 0-1.
The monthly emotion variations for our six different states are depicted in Figure 4. While most of the states show similar trends, there are some observable differences. We can see a rise in the anger and sad emotions from April, while fear and pessimistic start to rise from May. After May, anger starts to flatten out. However, sad, fear, and pessimistic continue rising up to the end of the period shown. We can also pick out some contrasts between the states. Missouri (MO; red), for example, shifts from having among the lowest proportions of fear and pessimism compared to other states in May, to having the highest proportions around June-August time.
It is important to pay attention to the scales in the graphs in Figures 3 and 4. We have zoomed in to show small fluctuations, whereas on a full 0 to 1 scale, as in Figure 2, the proportions of each emotion would look broadly flat over time. That being said, on a service like Twitter, with millions of users, even a half-percentage point change in the levels of happiness or sadness might mean that thousands of people have become more or less happy or sad in the space of a day, week or month.
For up-to-date analysis of the emotions contained in Covid-19 tweets, see the CoronaVis website.
Note
Covid tweets and data are available at github.com/mykabir/COVID19. Further data description and analysis are available at arxiv.org/abs/2004.13932.
About the author
Md Yasin Kabir is a PhD student in the Department of Computer Science, Missouri University of Science and Technology.
Sanjay Madria is Curators’ Distinguished Professor and director of the Wireless to Cloud Computing (W2C) Lab, Department of Computer Science, Missouri University of Science and Technology.


