
We are so overwhelmed by the conflicting messages given to us by supermarkets when they display Halloween paraphernalia alongside Christmas goods. Santa Claus costumes carefully tread a fine line on the intersection of the two and we end up feeling that the festive season is somehow tainted by this seasonal dilution. So it’s not unusual to believe there was a time when things were different. Surely in years gone by, Halloween and Christmas were subsequent and not simultaneous?
|
Editor's note Author Nathan Cunningham revisited his work in 2016 and, in doing so, he uncovered some issues with the data used in this analysis. For a full explanation, and a revised conclusion, read the updated article. |
Given the prolonged belief in the Christmas period’s persistent prematurity you would expect that by now we would be erecting our Christmas trees in June. Obviously this isn’t the case. Although as is often said, there’s no smoke without fire, so maybe there is some truth to the claim. Luckily, statistical analysis is on hand to put the question to bed.
Capturing the festive spirit
Initially I felt like a Grinch as I failed to capture the festive spirit, at least in the sense of having data to verify its presence at any point in time. In years gone by this may have been a major stumbling block, perhaps requiring the analysis of survey data over many years. Given the trivial nature of the research I deemed surveys to be an excessively burdensome undertaking. Fortunately there is a readily available source of data on the prevailing sentiment of society at any point in time.
We now live an increasing amount of our lives online and our internet activity has broadly come to reflect the prevailing sentiment of society towards particular ideas. This observation is widely exploited by advertising firms and is a large part of why social networks and search engines are so lucrative. If our online activity strongly reflects our interests then advertisements tailored to our internet activity are more likely to have the desired impact, and thus should command a higher price. Within the scope of this research, we would expect to see an increased volume of search activity in Christmas related terms in the build-up to the holiday season as we search for gift ideas, watch Christmas films, or listen to Christmas music.
Bearing this in mind, I gathered data on the volume of web searches for a number of Christmas related terms. The data shows the relative frequency of searches for a particular term over time. The terms I chose were those primarily associated with Christmas such as ‘Christmas’, ‘presents’, ‘Christmas tree’, ‘Santa Claus’, along with a number of Christmas films and a selection of popular Christmas songs. While these terms may be searched for throughout the year (surely we all know someone who listens to Christmas music year round) the search activity for these terms will be vastly different once the festive season is in full swing.
(How) Do they know it’s Christmas?
Having gathered the data to quantify the festive spirit, I had to decide when behaviour is sufficiently different to signify a transition into the Christmas period. In order to do this I turned to cluster analysis – an often used statistical technique used for sorting data into meaningful groups. These groups are constructed in such a way that the members within groups are similar to each other while being dissimilar to members of other groups. In this case the analysis looked at the construction of two groups – ’Christmas’ and ’Not Christmas’. In this case, the ‘Christmas’ group represented the period of time where searches for Christmas related terms were noticeably more frequent than in the rest of the year.
Specifically, the analysis was carried out using a constrained model-based clustering algorithm1. This assumes that the observations within our individual groups arise from statistical distributions which are characterised by different mean and variance values. One would expect that the mean search volume would be considerably lower throughout the non-Christmas period.
As the title suggests, the clustering algorithm is constrained. Why might this be necessary? Well, typically a cluster analysis will create groups of the most similar observations within the data. In the context of this analysis, this could mean a festive period consisting of a few days in October and the rest in December, with the intermittent periods assigned to the non-festive period. Traditionally this would not be the case, once the Christmas period begins it doesn’t end until it has run its course, usually the following January. It’s not common practice for shops to hang up Christmas decorations for a week in October, take them down in November, and then put them back up again in December. To account for this, the clustering assignment is constrained so that the festive period will only occur in an individual, unbroken period of time.
The graph below (Figure 1) shows how the data looks for a selection of the search terms in 2013. The peaks in the data reflect a period where the respective search term was frequently searched. The data only reflects search volume in Ireland as the festive season may get started at different times across countries.
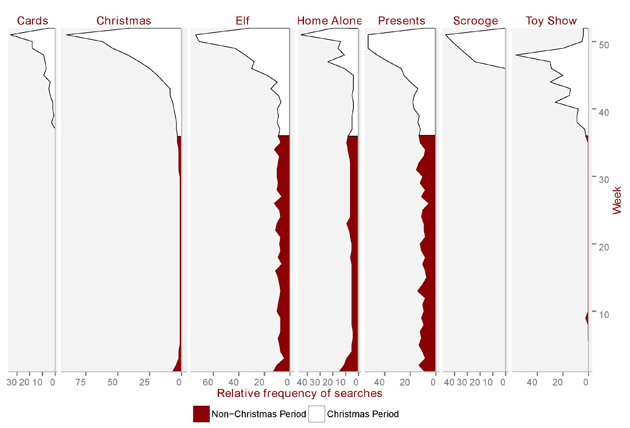
Figure 1: A selection of the data for 2013. The white area represents the period the analysis described as Christmas.
The colours in the data represent the results of the cluster analysis and the assignment of the weeks to the different periods in the year. White represents the Christmas period (ensuring a white Christmas) and red represents the non-Christmas period.
A simple eye-balling of the data is enough to spot that search trends towards the end of the year are vastly different to the earlier parts of the year, as we would expect. It should be noted that this simple visual analysis would not be able to demarcate definitively between the two groups. This is because Christmas related terms are regularly searched throughout the year as some terms have relevance beyond Christmas when taken in a different context. ‘Elf’ for example has year round popularity, perhaps due to the release of The Hobbit over the course of 2013.
So when did Christmas come?
For each year, the cluster analysis provided the probability of each week belonging to both the Christmas period and the non-Christmas period. The beginning of the Christmas period in each year was chosen as the earliest week that was more likely to belong to the Christmas period than not in my analysis.
The results, shown in the table and graph below, are a little startling. From a seemingly late beginning of November 11 in 2007, we had begun turning our minds to thoughts of the festive season as early as August 25 in 2013. While this of course seems absurdly early, it should be borne in mind that the beginning of the Christmas period here merely reflects our thoughts turning towards Christmas. Not the beginning of the full-blown holiday season. Nevertheless, it would appear that the prevailing notion is correct – Christmas is indeed coming earlier every year.
| Table 1: When did Christmas start? | |
| Year | Week beginning |
| 2007 | November 11 |
| 2008 | October 12 |
| 2009 | August 30 |
| 2010 | October 3 |
| 2011 | September 11 |
| 2012 | August 19 |
| 2013 | August 25 |
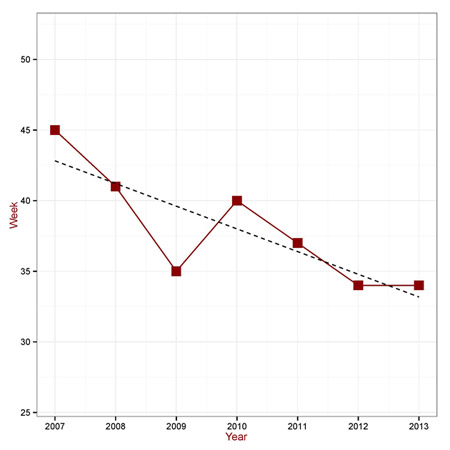
Figure 2 (right): The beginning of the festive period for 2007-2013 with the dashed line showing the trend towards an earlier Christmas period.
In just the seven years from 2007-2013 it appears that we have started thinking about Christmas close to three months earlier. There is some evidence that the difference between the 2007 and 2013 results is not an anomaly as the intervening years appear to agree with this general trend.
Given the sample size of just seven observations, it is difficult to confirm whether this trend reflects a true early arrival of Christmas, or is merely a chance observation resulting from random variation in the data. However, given the extreme nature of the findings, they alone provide food for thought and serve to further the popular notion that Christmas is coming earlier every year. As a fan of all things Christmas – I’ll admit that I’m the friend who listens to Christmas music all year round – I welcome the trend, long may it continue!
This article was a joint runner-up in the 2014 Young Statisticians Writing Competition, organised by Significance and the Young Statisticians Section of the Royal Statistical Society. The winning entry was 'Does New York City really have as many rats as people?' by Jonathan Auerbach. Our other runner-up, 'Do NHS records reflect patient ethnicity?' by Katie Saunders, was published online in December.
Footnotes
Final thought on the data and method I used here
Quantifying the sentiment of an entire society can be a difficult task, however with the increasing amounts of data collected on every facet of our activities online the task is becoming much simpler. As more and more data is gathered, it’s becoming possible to quantify abstract notions such as the festive season. This analysis shows how the proper application of statistical techniques can be used to challenge, or in this case, reaffirm the notions we hold without ever giving any serious consideration.
The techniques described here could also be used to distinguish periods of particular unhappiness in a society, possibly signalling future periods of unrest. I originally wrote the algorithm used here as a means of grouping fossil pollen data into distinct climatic periods. This analysis serves to highlight the possible wide ranging applications of even seemingly bespoke statistical tools. With the increasingly ubiquitous nature of statistical data and the advances being made in statistical methods, we can turn to statistical analysis to provide us with almost any answer, the difficult part is finding the question to ask.
1. Cunningham, N. and Parnell, A. (2011) Constrained model-based clustering with application to fossil pollen spectra. Manuscript in preparation.


