The Scottish poet, WD Cocker (1882 – 1970) is best known for 'The Deluge', a poem re-telling the Old Testament story of Noah and the flood. The poem starts:
The Lord tuik a staw at mankind,
A richteous an naitural scunner;
Slightly surprising, perhaps, that God appears to be a Glaswegian, but who has not been on holiday in Scotland and thought the end of the world might be nigh.
I have found myself thinking about this passage recently, not because of anything I've done I can assure you, but because it seems to have been raining a lot. When I say it has been raining a lot, I mean that the summer seems to have been generally miserable, but I can also remember one day when it absolutely bucketed down. In other words, the average rainfall over the summer seems to have been higher than usual but we also seem to have had days when rainfall has been extreme. Being able to characterise the frequency of extreme weather events is quite important. If you live next to a river and want to buy insurance against flooding, for example, the insurer will set premiums with regard to the frequency with which the river level is expected to rise sufficiently to flood your house. In order to briefly illustrate how we can use statistics to quantify (if not to change) the weather, in the following we’ll use data on daily rainfall published by the Met Office going back to 1931. The data is available at a regional level and, since we are looking at rainfall, I have used the series for north west England. The data reflect the level of rainfall taking place over a fairly broad area and will not capture detailed variations.
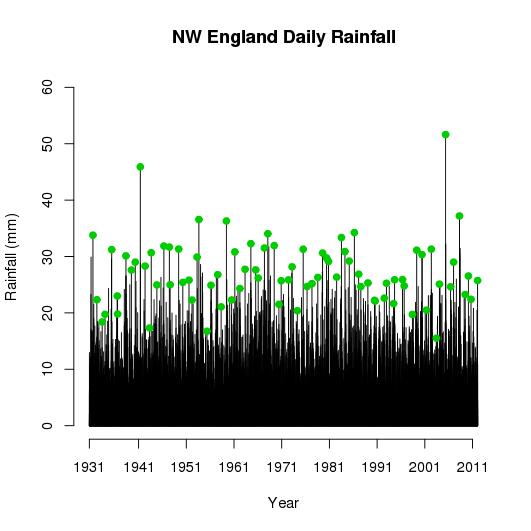
The figure below plots the recorded level of daily rainfall in millimetres in north west England over the period from 1931 to 2012. The techniques used to estimate the frequency of extreme events do not use all the recorded data but only the maximum values in a given interval, usually a year, and the green dots are the wettest days in each year. The highest recorded rainfall across the region was in 2005 with more than 50mm of rain falling on the 11th of October. The rainfall on that day was due to ‘a vigorous frontal trough’ passing over the UK, which resulted in a month’s rainfall in 48 hours in many places in the north west. The lowest recorded maximum rainfall in a year was in 2003 when the maximum rainfall in a single day was just 15mm.
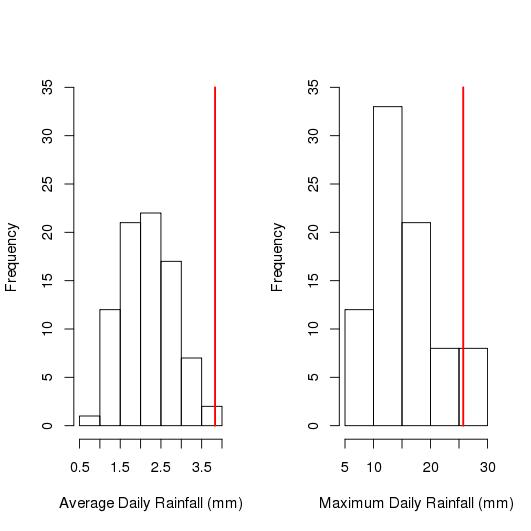
In order to see if rainfall this year has been higher than usual, the histogram on the left in the figure below plots the average daily rainfall in May and June in each year. The figure shows that the level of rainfall you would expect on an average day in NW England in May and June is somewhere around 2.2mm. The figures for average daily rainfall in each year have a rough bell-shaped distribution which is expected from statistical theory. This year the average daily rainfall in NW England over May and June was 3.8mm, shown by the red line, so average rainfall this year has certainly been higher than usual. Have we had days, however, when rainfall has been extreme? The histogram on the right plots the maximum rainfall observed in May and June in each year from 1931 to 2012. The reason we only use the maximum values is that these are assumed to result from a different process to that producing daily rainfall. The red line again gives the maximum observed in May and June this year which was slightly more than 25mm on the 22nd of June. There was, as a result, some flooding but how often might we expect this to occur?
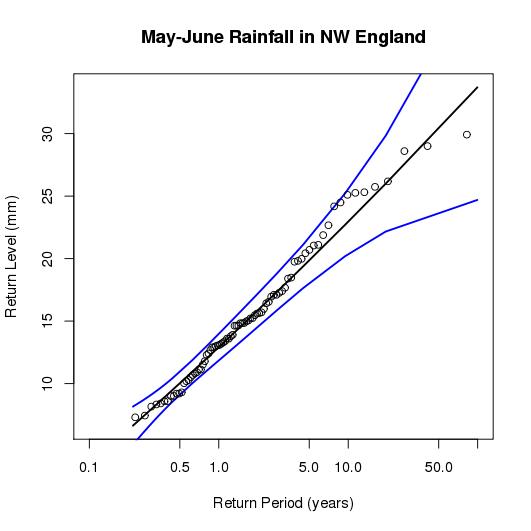
The maximum level of daily rainfall in each year is not expected to follow the same type of bell-shaped curve as the average. A less well known result from statistical theory tells us, however, that the maximum value should follow what is aptly termed an extreme value distribution. Knowing this is useful because it allows us to predict how often we would expect weather events of a given severity. In technical terms, the frequency is termed the return period (eg. once every 50 years) and the severity the return level. The figure below plots the return period and return level for the values of maximum rainfall in May to June in north west England. The x-axis is plotted on a logarithmic scale and if the data do follow an extreme value distribution they should lie along a straight line. Reassuringly this is roughly the case and the data points also fall within the confidence limits given by the blue lines. The figure shows that we would expect 30mm of rainfall (the y-axis) on average about once every 50 years (the corresponding figure on the x-axis). The maximum rainfall this year (ie. 25mm) would be expected to occur roughly every 20 years. So, in the north west at least, we don’t seem to have had any extreme weather events this summer, it has just rained a lot.