
But are there really this many rats in NYC? And, if so, where in the city are they found? Answers to these questions are important because rats are far more than a nuisance; they are a threat to public health. Rats spread lethal diseases, most famously the bubonic plague of the fourteenth century. That disease was circulated by fleas on black rats and notoriously eradicated a third of the European population.
Rats ravage food supplies and bite humans. They also gnaw on cables. It has been estimated that 26% of electric cable breaks and 25% of fires of unknown origin are caused by rats. Knowing the size and distribution of the city’s rat population is crucial, then, for the city to evaluate the scope of the threat and to gauge the effectiveness of its control strategies. But is it possible to measure the size and distribution of the NYC rat population?
Statistical rat catcher
Getting an accurate count of any animal population is difficult. Animals are terrible survey respondents. Fortunately, there is a clever way around this problem. Ecologists have developed a survey method called capture-recapture estimation, which is used to approximate the abundance of wildlife. There are many versions of capture-recapture estimation, but the simplest is the two-sample version.
Suppose we wanted to use this method to determine the population of rats in NYC. First, we would capture a random sample of rats and mark them. Then we would release the marked rats into the city and wait for them to mix with the general population. Finally, we would capture a second random sample. Some of these rats would be marked, indicating that they have been recaptured. Since we allowed the marked rats to mix with the population, we reason that a marked rat is equally likely to be caught in the second sample as an unmarked rat. We can use the proportion of marked rats in the second sample to estimate the total population of rats.
Now, suppose we marked 10,000 rats and observed that 1% of the rats captured in the second random sample were marked. We would assume that 1% of the total population must be marked since a marked rat is as likely to be caught as an unmarked rat. We can therefore conclude that there are 1,000,000 rats in the population since 10,000 is 1% of 1,000,000.
Unfortunately, NYC’s Department of Health and Mental Hygiene is unlikely to approve a large-scale rat-releasing experiment (I know, because I asked). So, instead, we have to rely on an alternative.
The Department of Health releases a lot of great information on rats, and of particular interest is a data set on rat sightings reported to the city’s service request hotline, reached by dialling 311. It is publicly available on NYC’s data portal. The data set contains the location of each reported sighting, and while we cannot mark individual rats, we can classify these locations by city lot (of which there are roughly 842,000 in NYC) and mark the lot in which these rats were sighted.
If we adapt two-sample capture-recapture estimation to approximate the number of city lots harbouring rats, we can then multiply the total number of inhabited lots by the average number of rats per inhabited lot to recover the population of rats. Of course, this method will not account for rats living below ground or basement level – but it is a myth that large ‘cities’ of rats live within NYC’s subway and sewer system, says the Department of Health.
Pest management professionals who set traps on rat-inhabited lots can estimate the average number of rats per inhabited lot, and in order to estimate the number of rat-inhabited lots in NYC, we will follow steps similar to capture-recapture. For reference purposes, let us call this adapted procedure ‘lot comparison’.
We first observe the number of lots that reported a rat sighting during the first half of 2010. These lots constitute our first sample and are our ‘marked’ lots. Then we observe the number of lots that reported a rat sighting during the first half of 2011. These lots constitute our second sample. Some of them are ‘marked’ in that they were also identified within our first sample. A ‘marked’ lot that appears in the second sample period has been ‘recaptured’. If we assume that a recaptured lot is as likely to be reported as any other rat-inhabited lot, the proportion of ‘recaptured’ lots in the second sample period will then provide an estimate of the total number of rat-inhabited lots.
Spotted
A visual example of lot comparison can be seen in Figure 1. The map shows the area east of Bedford-Stuyvesant in the Brooklyn borough. This area has an above average volume of rat sightings for NYC.
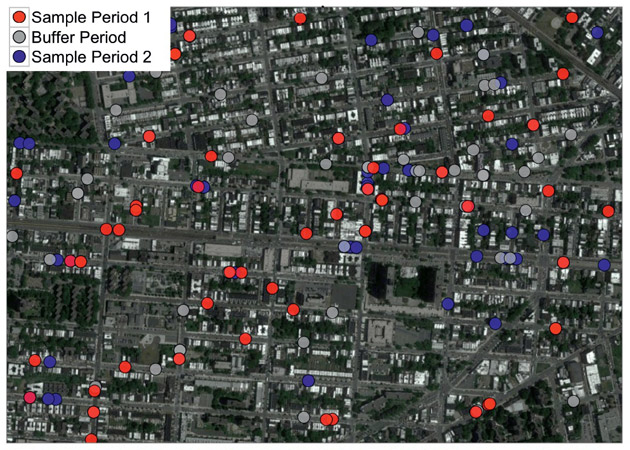
Figure 1: A visual example of lot comparison estimation using the area east of Bedford-Stuyvesant in the Brooklyn borough between January 2010 and July 2011. Rat sightings are coloured by sample period
On this map of reported sightings, 48 lots were identified as rat-inhabited in the first sample period (the first half of 2010, colored red) and 37 lots were identified as rat-inhabited in the second sample sample period (the first half of 2011, colored blue). Seven lots were present in both samples (although, if the rat sightings came from opposite sides of the lot, they might not be overlapping on the map). This represents 19% of the 37 lots identified in the second sample period. Therefore, we assume that we observed 19% of the total rat-inhabited lots in the first sample period. Since we observed 48 lots in the first sample period, the estimated total number of rat-inhabited lots is around 250, since 48 is 19% of 250.
From the map, it appears as if rats occupy a large percentage of the land depicted. Our estimate, however, suggests that rats inhabit a relatively small proportion of the total lots.
This discrepancy between the high rate of sightings and relatively low rate of rat-inhabited lots is due to the fact that a relatively high number of these lots intersect between the sample periods. If only three lots were present in both samples, the estimated total number of rat-inhabited lots would have been around 400.
Rat sightings in this data set are most frequently reported by tenants or neighbouring residents. How do we ensure that these reports will be good ‘marks’? Determining whether this 311 data set can be used to approximate the population of rat-inhabited lots necessitates a review of the assumptions underlying our estimation procedure. We consider the two most important assumptions:
1. Rat-inhabited lots reported in the two sample periods are randomly and independently identified from the total population of rat-inhabited lots. This means that:
(a) rat-inhabited lots are equally likely to be reported to 311;
(b) any lot identified as rat-inhabited during the first sample is as likely to be identified during the second sample period as any other inhabited lot.
2. The population of rat-inhabited lots being estimated is closed. That is, the total number of rat-inhabited lots does not change throughout the study period.
Our investigation is carefully designed so that these assumptions are reasonable.
Let us start with the first assumption. There are many reasons to believe that individuals in certain parts of the city are more likely to report a rat than in other parts of the city. As can be seen in Figure 2, reported rat sightings are concentrated in a minority of NYC’s 195 neighbourhoods. In fact, 20% of the neighbourhoods account for 50% of all calls.
{mbox:significance/graphs/new-york-rats-fig2.jpg|width=630|height=398|caption=Click to enlarge|title=Figure 2: The frequency of rat sightings reported to New York City’s service request hotline by neighbourhood tabulation area (NTA) from 2010 to the present. Grey areas represent parks or other areas excluded from this analysis.}
This distribution of reported sightings may reflect not only the occurrence of rat-inhabited lots, but also factors such as land use, geography, cultural values, or human population density. For this reason, rat-inhabited lots may not be reported to 311 with equal probability across the city’s diverse neighbourhoods (neighbourhood tabulation areas, or NTAs). This would appear to call the validity of assumption (a) into question. However, we can confine our study to one neighbourhood at a time. In each neighbourhood it is reasonable that reported sightings would be equally likely among inhabited lots since the neighbourhoods used in this study were constructed to represent communities with similar characteristics.
To satisfy assumption (b) (independence across sample periods), we chose our study period strategically. Our data set contains the date each rat sighting was resolved by the city. These resolutions indicate that the city took an action. For example, the city may have instructed a property owner to clean their property, or it may have hired an exterminator to trap the rats on the property owner’s behalf. Using this information, we create a six-month buffer period between the two sample periods during which every rat sighting report from the first sample period is resolved. This buffer serves as a ‘cool-down’ time, ensuring that reports made in the second sample period will only pertain to new sightings and are not contingent upon previous sightings. Since every report from the first sample period has been resolved by the beginning of the second sample period, we claim that the two samples are independent of each other (see Figure 3 below).
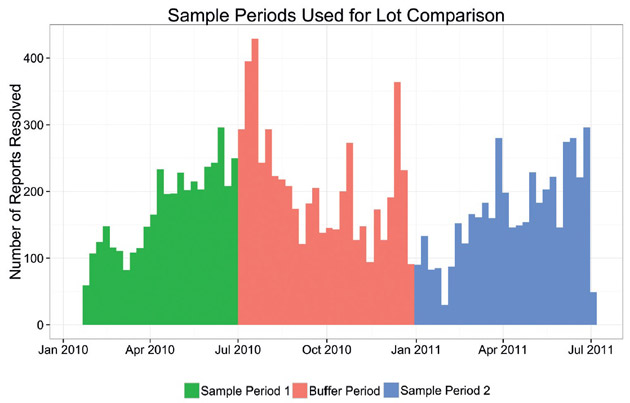
Figure 3: Sample periods were chosen so that rat sightings in the first sample period would be unrelated to rat sightings in the second period. Every rat sighted between January and July 2010 (sample period 1) has been resolved by January 2011 (the beginning of sample period 2)
Now let us consider the second assumption. A limitation of this study is the fact that the population of rat-inhabited lots is not closed. Property owners and city workers are actively trying to cleanse lots identified by the 311 system. It is important to note that this is a limitation shared by nearly every capture-recapture study since a population is rarely closed; there are always births, deaths and migrations within a population between samples. By waiting six months between samples, we minimize this problem because significant rat control efforts generally occur in the summer and cease by the end of autumn. These efforts can greatly reduce a rat population, but the success is often short-lived. It is extremely difficult to completely eliminate the presence of rats, and the remaining rats often repopulate quickly. It is for this reason that professionals prefer the description of pest management to pest extermination.
Lots of results
The complete lot comparison procedure yields a total of 40,500 (±3,000) rat-inhabited lots in NYC. That is 4.75% of all lots in the city. Figure 4 depicts the percentage of rat-inhabited lots by city neighbourhood. By comparing this with the 311 call map in Figure 2, we can identify many large suburban neighbourhoods in Brooklyn that have high 311 call rates but relatively low rates of rat-infested lots.
{mbox:significance/graphs/new-york-rats-fig4.jpg|width=630|height=403|caption=Click to enlarge|title=Figure 4: The estimated percentage of New York City rat-inhabited lots by neighbourhood (NTA) as estimated by lot comparison for the 2010 – 2011 study period. Washington Heights (1), the East Village (2) and Stuyvesant Town-Peter Cooper Village (3) are identified as having large concentrations of rat-inhabited lots.}
This discrepancy happens for two reasons. First, Brooklyn sightings are more likely to happen in the same lots. Second, Brooklyn tends to have larger concentrations of smaller lots. In contrast, Manhattan sightings tend to come from different lots, and those lots make up a larger percentage of the total number of lots in each neighbourhood.
With a figure of 40,500 rat-inhabited lots, we can give an estimate for the total number of rats in NYC. We know that 40 – 50 rats belong to a typical colony and that colonies are territorial; it is unlikely that two colonies will inhabit the same lot simultaneously. Now suppose, quite generously, that each rat-inhabited lot supports its own, unique colony of 50 rats. That would suggest that NYC has roughly 2 million rats (±150,000)
This is a far cry from the urban myth of 8 million rats. In fact, each lot would need to support its own colony of around 180 rats for a total population of 8 million to be plausible. Therefore, our method does not support the hypothesis that there are 8 million rats in New York City.
Indeed, our lot comparison method likely overestimates the population of rats in NYC. This is because we treat every lot with at least one rat sighting as evidence that a full colony of rats inhabited the lot for the duration of the study period. However, it is possible that the territory of one rat colony encompasses several lots. Since we do not know the extent to which a rat colony has established itself on each reported lot, we proceed as though each reported lot is associated with a full colony of rats.
This overestimation allows us to be confident that there are not 8 million rats in NYC. How confident? That is, could our estimates deviate significantly from reality? It is always a possibility that one big lot will support multiple colonies of rats or that large reservoirs of rats exist and are never reported to 311. Therefore, this study is best seen as part of an ongoing investigation that will change as new evidence is brought to light and our underlying assumptions are refined.
Such ongoing investigations are the reality of data analysis in the public sector, and the statistical problems that arise from these investigations are not unique. There are tens of thousands of 311 reports every month for hundreds of different service requests. By employing methods such as capture-recapture, these reports can be used not only to serve the needs of the callers, but also to understand the pervasiveness of the need throughout the city population. Government can then leverage the ‘big data’ it generates to create comprehensive policies that address the full scope of problems the city faces.
This article was the winning entry to the 2014 Young Statisticians Writing Competition, organised by Significance and the Young Statisticians Section of the Royal Statistical Society. This article is republished from the October edition of Significance.
Acknowledgements
I thank the NYC Department of Health and Mental Hygiene for their comments and insight. References include: Lohr, Sharon (1999) Sampling: Design and Analysis (Duxbury Press), and Sullivan, Robert (2004) Rats: Observations on the History and Habitat of the City’s Most Unwanted Inhabitants (Bloomsbury).


