
In 2022 Emmanuel Macron, the President of the French Republic, sought re-election against opponents of various political persuasions. The challenge for Macron was to win another five-year term against a background of post-Brexit readjustment and the Ukraine crisis. The challenge for me, as the author of this article, was to see whether techniques adapted to Anglo-American partisan elections (see here and here) would cope with a Francophone election with different traditions.
In order to become a candidate for the French presidency, an individual must get signed nominations known as parrainages, or sponsorship, from more than 500 elected local officials (known as parrains or sponsors), mostly mayors. The candidates are usually members of political parties, although those parties may have been formed around that individual for election purposes. A popular vote is held across France and the top two candidates with the most votes go through to a runoff election some weeks later. The winner of that runoff election is the one with the most votes. The two major differences to US Presidential elections are the shorter life-spans of the parties and the two-stage nature of the election.
During this process there are many predictors: modellers model, bookies take bets, and pollsters poll. Which of them had predicted the outcome of the 2022 election, and how far out had they done so? This article sets out to answer that question, by analysing the performance of pollsters, seat and vote modellers, and betting firms all the way up to the round two election day.
Dates, metrics, candidates, results, and predictors
To examine the performances of predictors over time, we must know who was predicting what at different points in time. The datum dates we select are given below. We will capture our predictors at these dates:
- The first day of the month before round one – 1 March 2022
- The day on which the official round one candidates were selected – 7 March 2022
- Ad hoc date – 28 March 2022
- Ad hoc date – 05 April 2022
- The day before round one election – 9 April 2022
- Ad hoc date – 17 April 2022
- The day before round two election – 23 April 2022
In line with our previous articles, we will use two metrics: mean absolute error (MAE) and WIN (a metric that scores a prediction on whether it did (= 1) or did not (= 0) predict the eventual winner). Typically, for US and UK elections, we have analysed predictor performance on a two- or four-party-forced format (see here for a fuller discussion of x-party-forced format, our metrics and our choice of predictors). But the shorter life span of French political parties poses a problem: how can we use an x-party-forced prediction metric if parties are not stable from election to election? To see the problem, consider the table below, which shows the parties securing 5% or more of the vote from each presidential election in the Fifth Republic since 1958.
Table 1: Parties securing 5% or more of the vote in round one in presidential elections in the Fifth Republic[0502a].
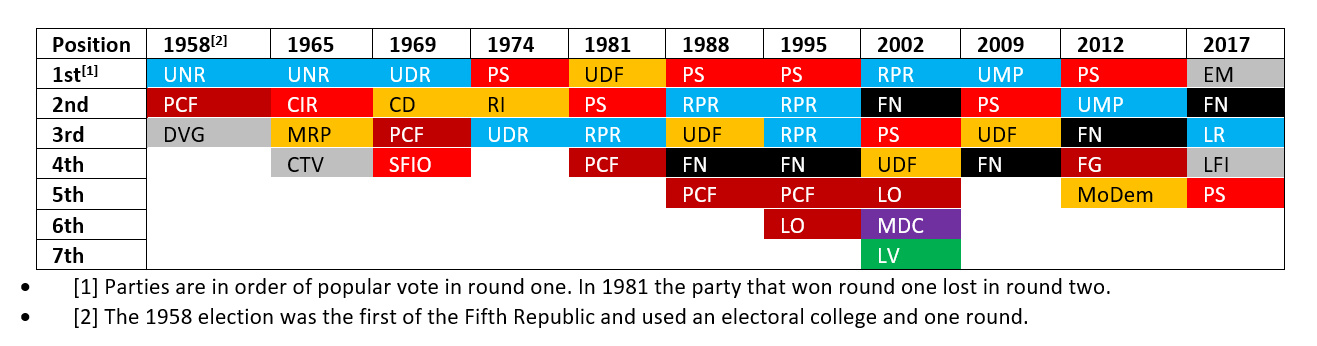 The colours in the table are a subjective choice by me to attempt to categorise the parties into political families (PCF, FG are Communists; VO, LO are Trotskyists, grey is unsure, etc.). But we are falling into a trap here: we are attempting to place an overarching long-term political-party structure on a country that just hasn’t got one. Even worse, we are doing it from the author’s best guesses which, while defensible, might still be wrong.
So, if we can’t reliably assess the performance of the predictors on the basis of political party or strand, then the only thing remaining is to do so by political candidate. Therefore, instead of a x-party format, we will use a x-person format. Specifically, we will select the top five candidates on datum date one and use five-person-unforced (Individual A/Individual B/Individual C/Individual C/Individual D/Individual E) to assess accuracy.
The question now arises as to the threshold of acceptable performance: at what point do we deem a prediction to be a failure? After consideration (see Appendix 3 in the Appendices document) we settled on a MAE threshold of 2% for five-person-unforced. For the WIN indicator it was simple: if a majority of predictors accurately produced the winner then it was a success.
The five candidates we will focus on are the top five in the polls on the first datum date:
- Emmanuel Macron (En Marche!)
- Valerie Pécresse (The Republicans)
- Marine LePen (National Rally)
- Jean-Luc Mélenchon (La France insoumise)
- Eric Zemmour (Reconquete)
As regular readers of the “Forecast Error” series will know, an oft-overlooked problem is working out what the final result of an election actually was. Initial public commentary is based on ad hoc data collected by newspapers or television channels. But the actual final results are usually published later by an official organisation, and these final results may differ slightly to the contemporary media reports. The differences are typically slight but sometimes enough to make the error rate change a decimal point.
For the 2022 French Presidential election, we will use the following sources:
- Initial media reports – France24 (France) and The Guardian (UK). (For 2017 examples, see[0313d])
- Final results – Constitutional Council of France. (For 2017 examples, see[0313e])
The predictors we will use will be nationwide opinion polls, betting odds and spreads, and models. (For a discussion of which pollsters, betters and modellers were selected and why, see the full unedited version of this article).
Predictions prior to round one voting
Having decided on our predictors, we now need to record the predictions they made prior to round one voting. We see below the values over time for vote shares in round one. Predictions that are unchanged at different dates are marked “-“.
Table 2: Average pollster-predicted vote shares in round one at datum dates 1-5[0502d].
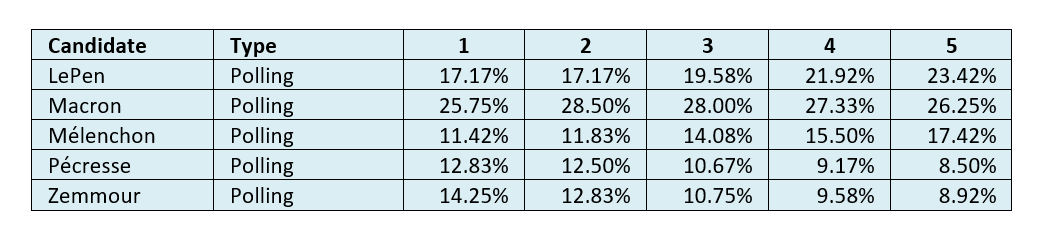 Table 3: Average non-academic-predicted vote shares in round one at datum dates 1-5[0508a].
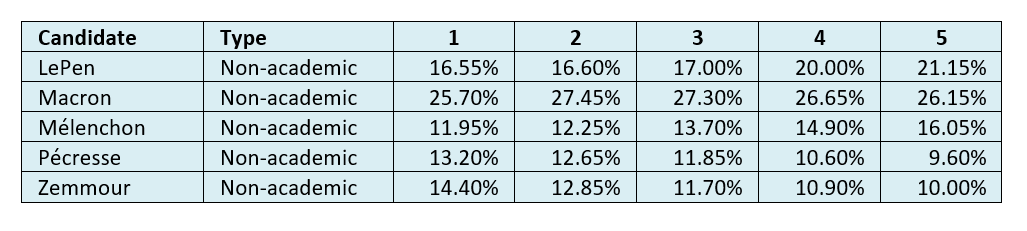
Table 4: Average academic-predicted vote shares in round one at datum dates 1-5[0508d].
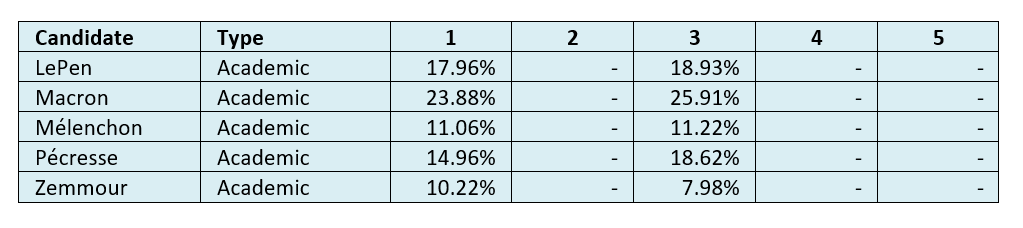 Academic predictions were initially made and uploaded in January or February and then preprints were updated on 23 March 2022. Most were the same, but some were altered slightly, hence the change between datum date 1 and 3.
Below we see the values over time for the probability of a top two finish.
Table 5: Average bookmaker-predicted probability of a top two finish at datum dates 1-5[0508e].
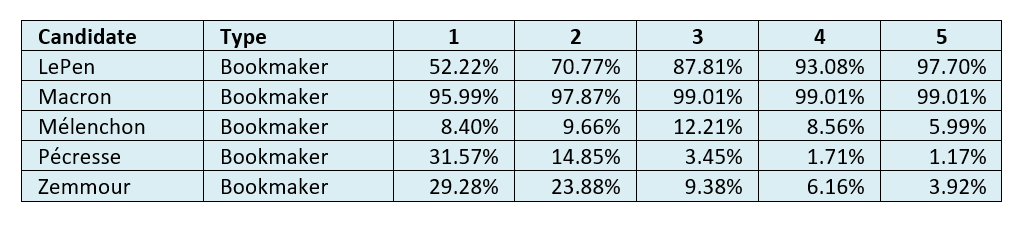
Table 6: Average non-academic-predicted probability of a top two finish at datum dates 1-5[0508f].
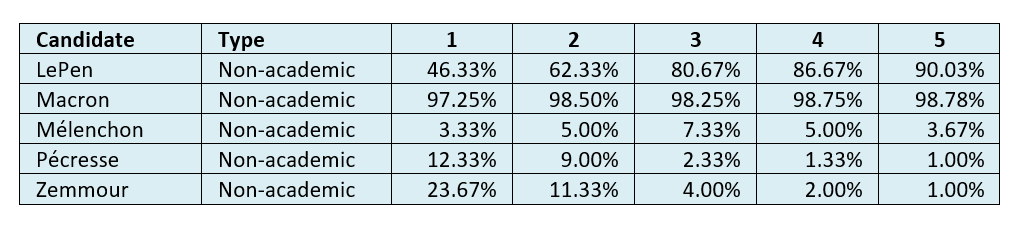
On these numbers, Macron and LePen looked set to easily go through to the second round, Mélenchon would again have a respectable third place, and Zemmour and Pécresse would battle for last place.
How well did our predictors do after round one voting?
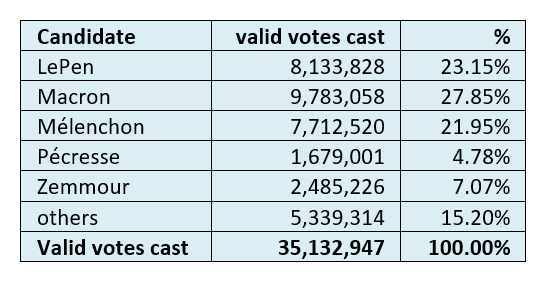
Table 7 shows the results of the round one voting.
Table 7: Results of round one voting[0529a].
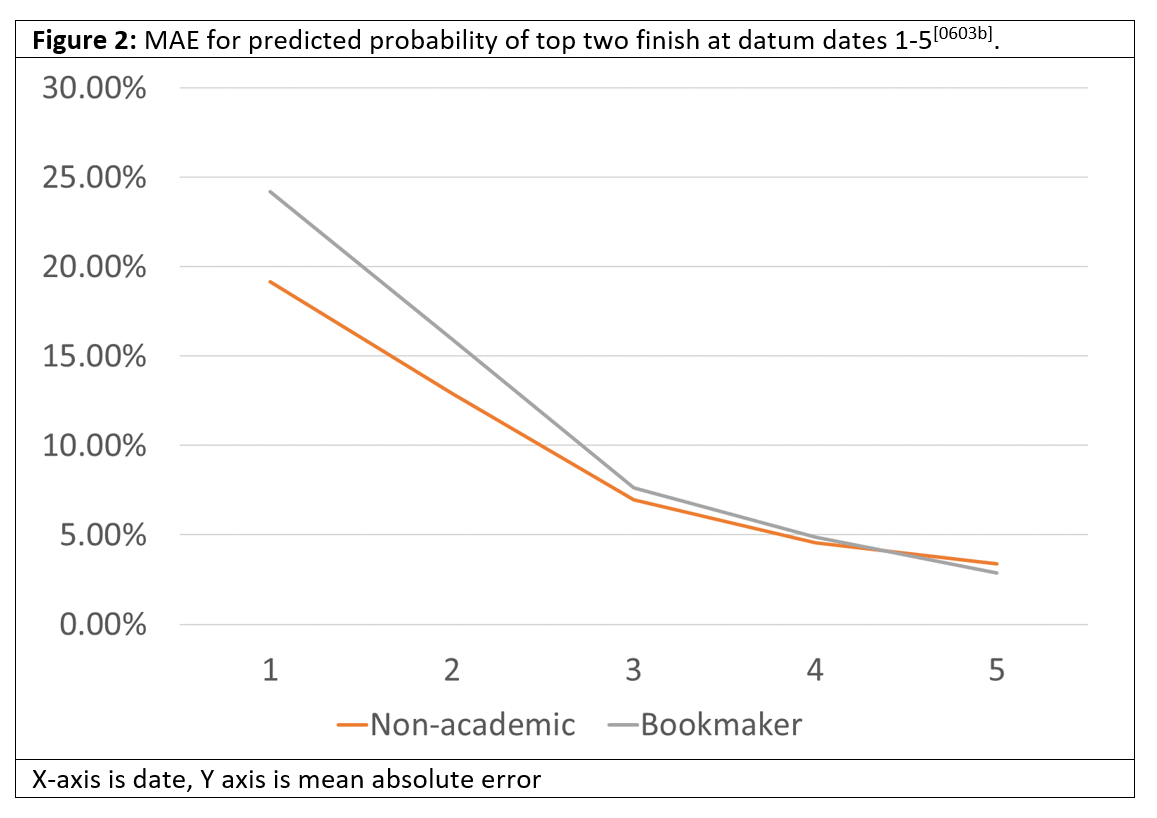
In the figures below, we graphically depict the MAE accuracy of the predicted vote shares in round one, and the predicted probability of top two finishes.
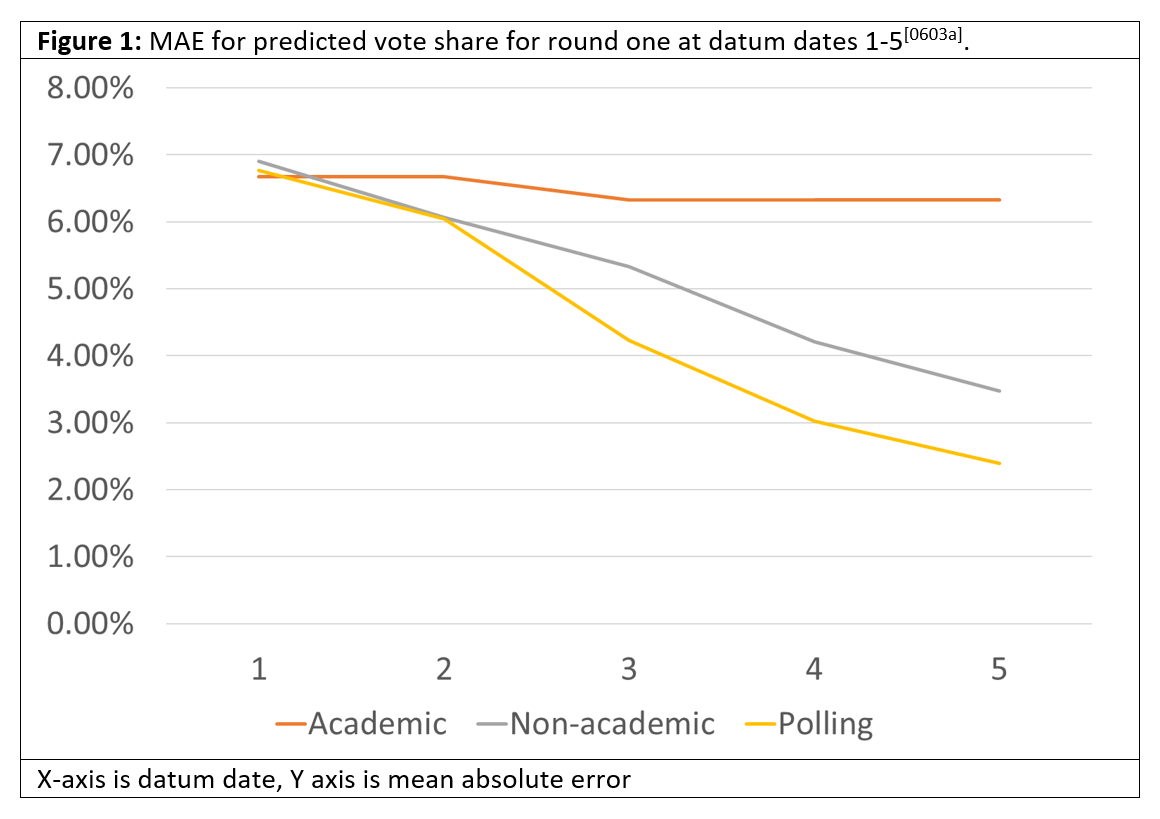
With the exception of the academic predictors who did one-and-done predictions and could not correct as time passed, the accuracy of our vote share predictors increased over time but did not reach the 2% threshold required for a five-person-unforced (5PU) metric.
As noted in our previous work, the accuracy of probabilistic predictions is inherently worse than the accuracy of deterministic predictions (that’s why they’re usually measured using calibration instead of MAE). In this case they improved dramatically as time wears on but again did not achieve our 2% threshold.
Table 8 and 9 show the WIN accuracy of the predicted vote shares in round one, and the predicted probability of top two finishes.
Table 8: Mean WIN indicator for predicted vote share for round one at datum dates 1-5.
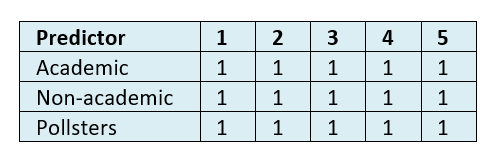
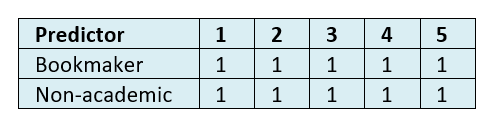
Table 9: Mean WIN indicator for predicted probability of top two finish at datum dates 1-5.
To put it simply, at no point in the five datum dates prior to the round one election did anyone seriously think that anybody other than Macron and LePen would contest round two.
Predictions prior to round two voting
We see below the values over time for the predicted probabilities of candidates winning round two. Cases where no predictions were made are denoted by a greyed-out cell, and predictions that are unchanged at different dates are marked “-“.
Table 10: Average bookmaker-predicted probability of winning round two at datum dates 1-7[0508g].
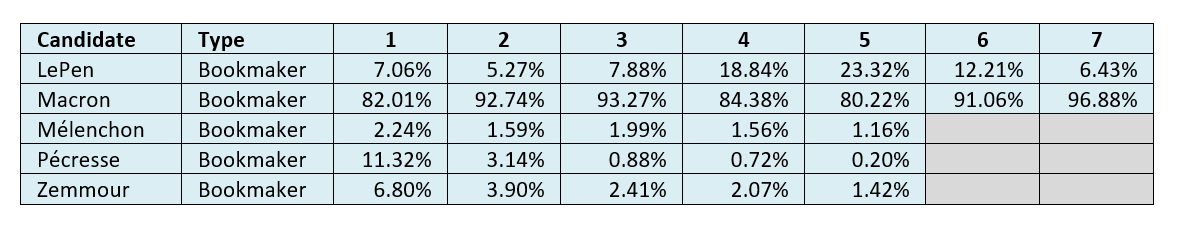
Table 11: Average non-academic-predicted probability of winning round two at datum dates 1-7[0508h].
And here we see values over time for predicted vote shares per candidate in round two. The abnormally large numbers for Pécresse are highlighted in red.
Table 12: Average pollster-predicted round two vote share at datum dates 1-7[0326a].
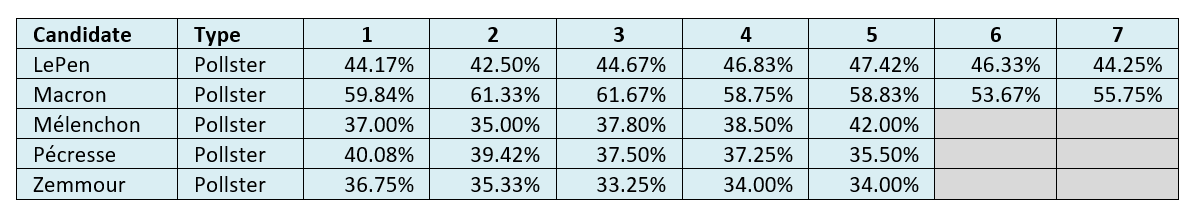
Table 13: Average academic-predicted round two vote share at datum dates 1-7[0508i].
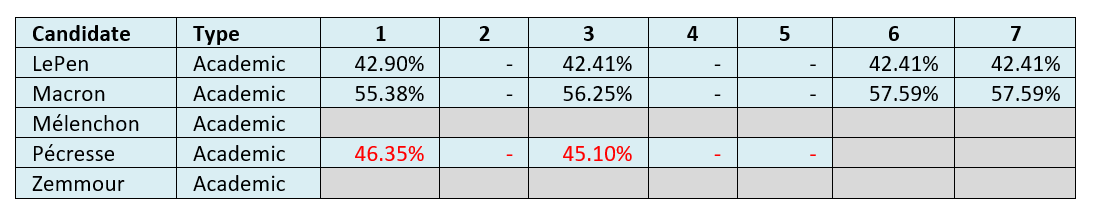
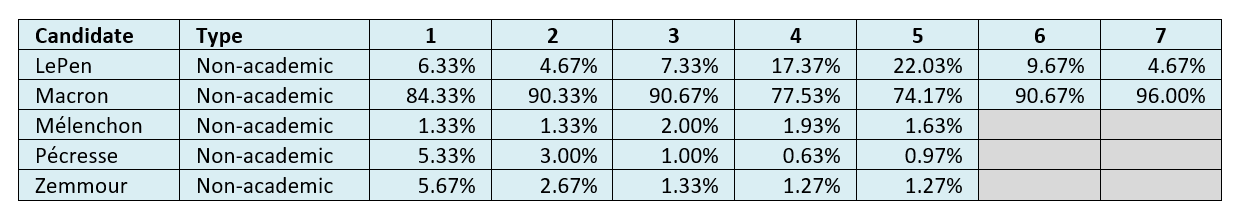
Table 14: Average non-academic-predicted round two vote share at datum dates 1-7[0508j].
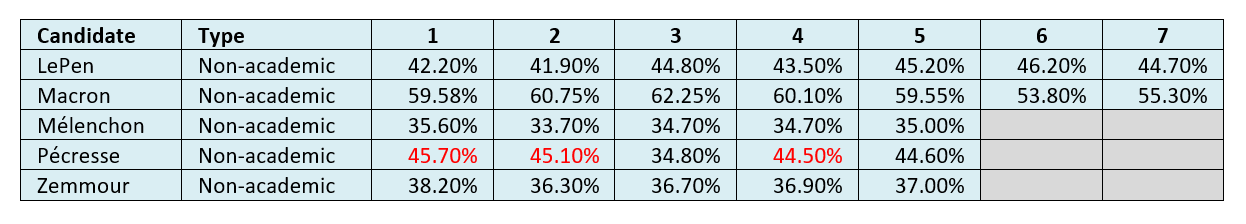
Finally, the tables below show values over time for vote shares per candidate and opponent in round two. Again, the abnormally large numbers for Pécresse are highlighted in red.
Table 15: Average pollster-predicted round two vote share per candidate and opponent at datum dates 1-7[0326a].
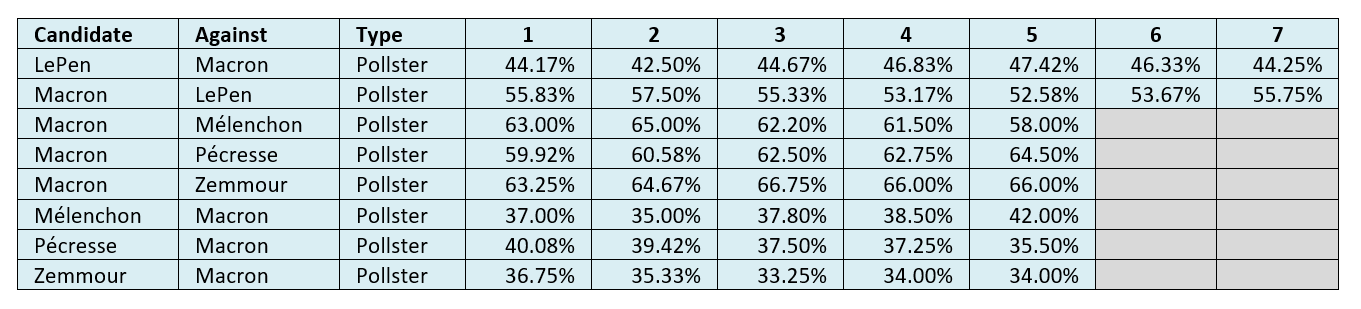
Table 16: Average academic-predicted round two vote share per candidate and opponent at datum dates 1-7[0508i].
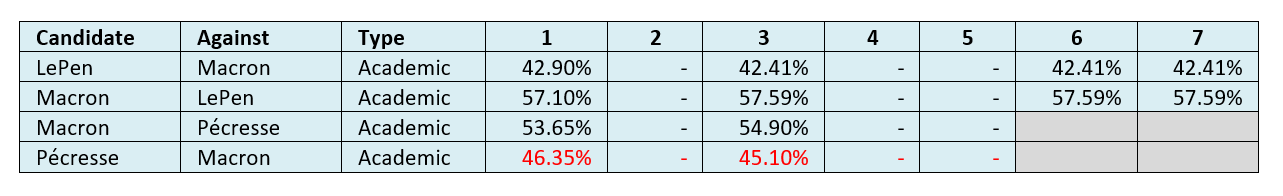
Table 17: Average non-academic-predicted round two vote share per candidate and opponent at datum dates 1-7[0326a].
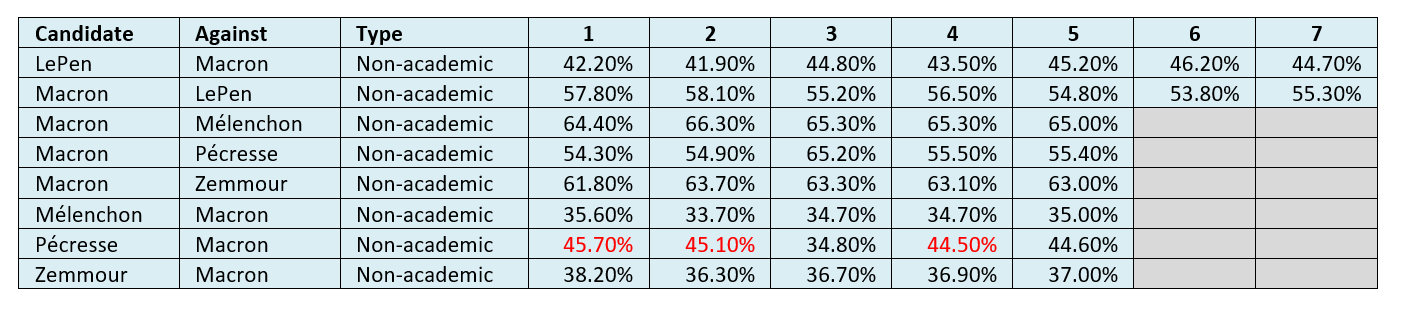
On these numbers Macron was predicted to win round two, with a consistent lead throughout the datum dates. Although LePen did eat into Macron’s lead up to the round one election, she lost ground during round two. We note that our selected academics did not make round two vote share predictions for Mélenchon and Zemmour, which affected our assessments on a five-person-unforced basis. The abnormally large estimates for Pécresse (labelled in red) were also noted. We will discuss these points later.
How well did our predictors do after round two voting?
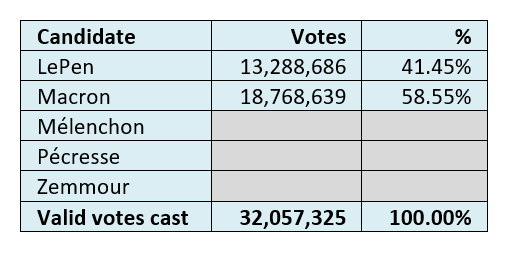
Table 18 shows the results of the round two voting.
Table 18: Results of round two voting[0529b].
Again, we graphically depict the MAE accuracy of the predicted probability of winning round two, and the predicted vote shares in round two.
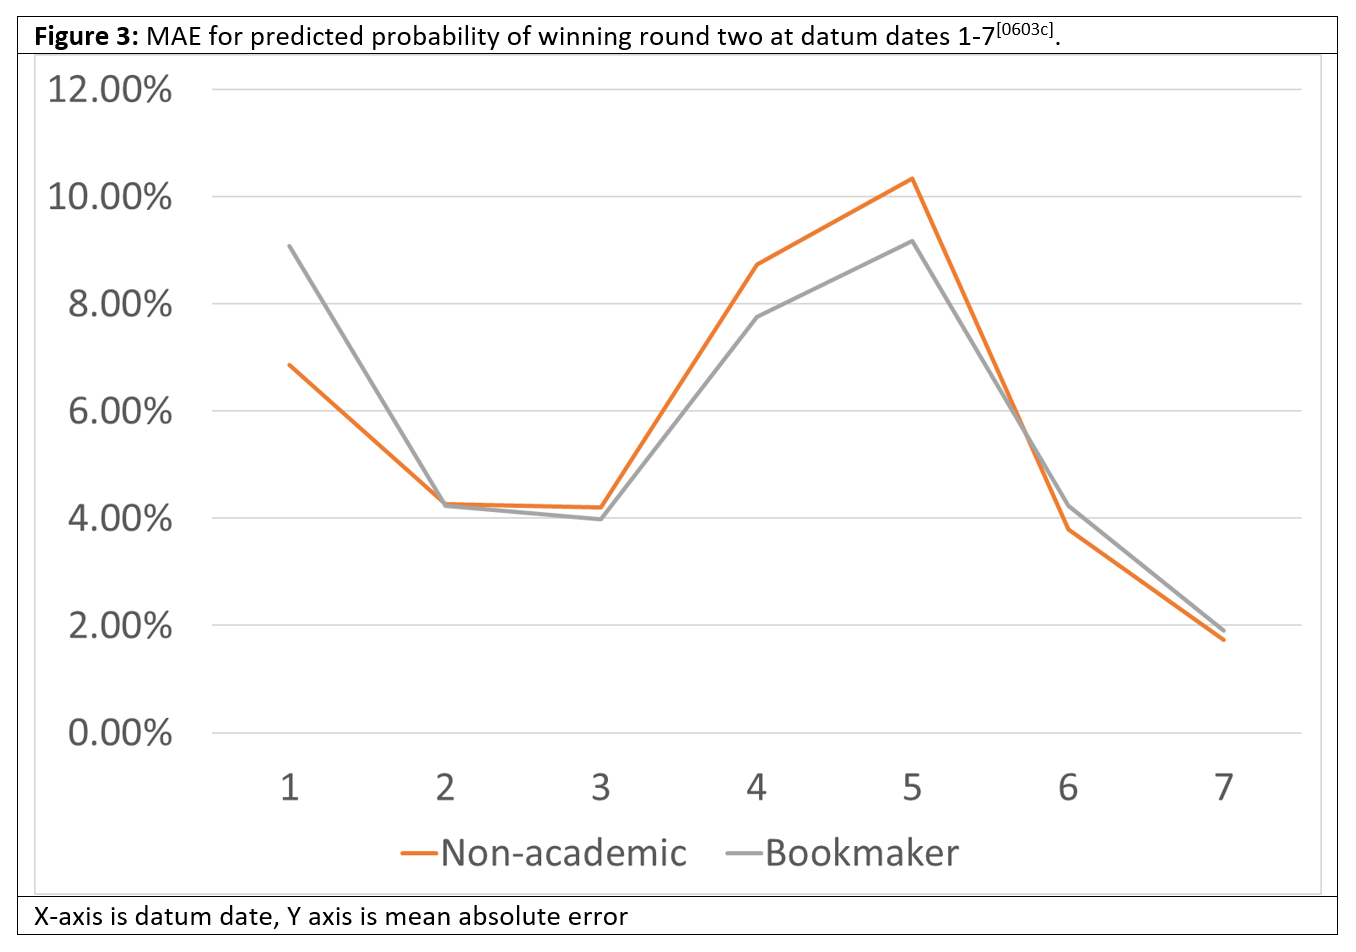
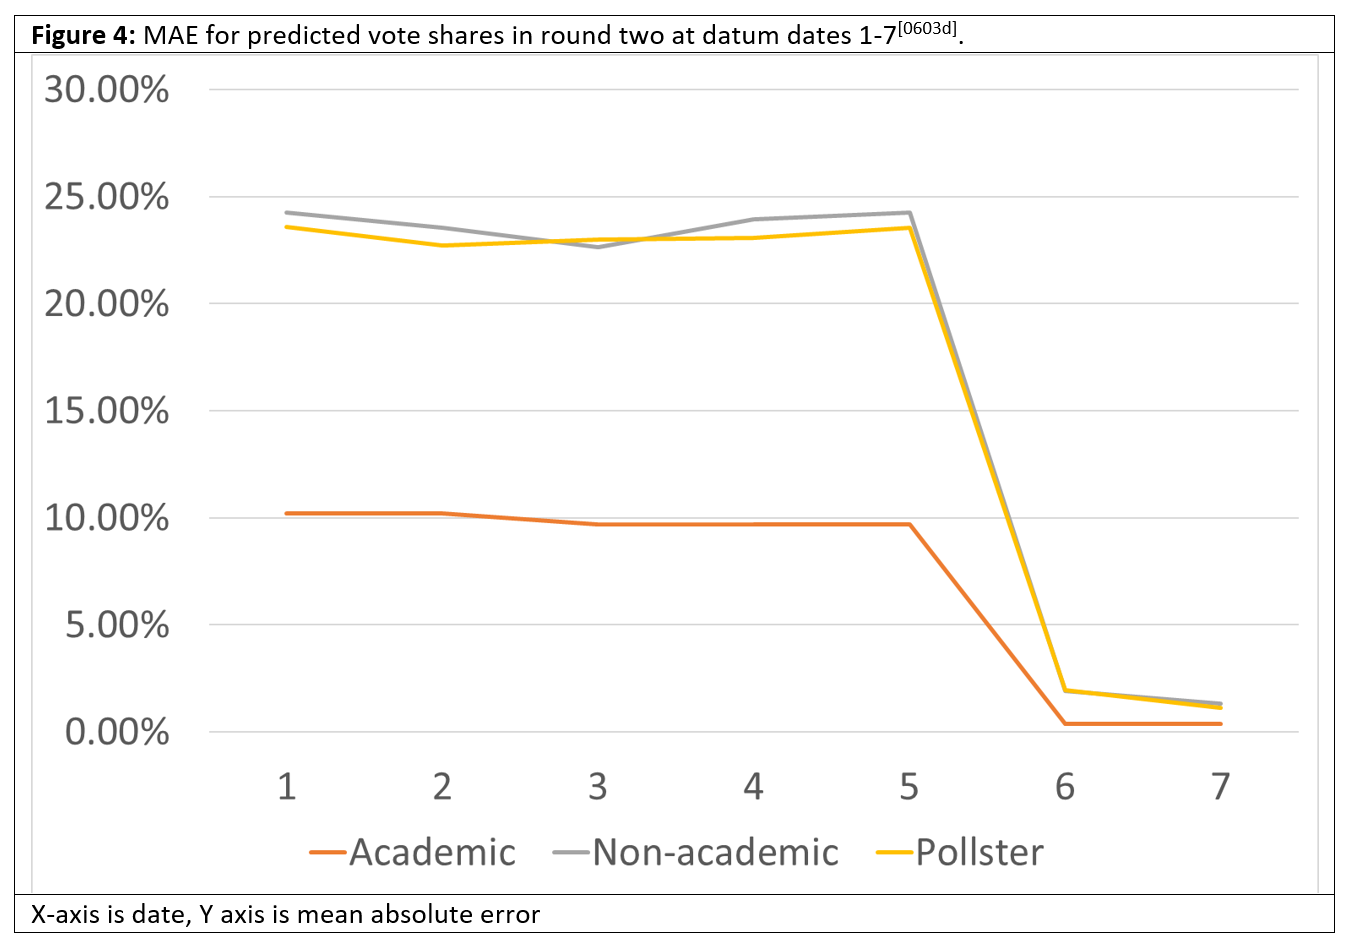
Here we see something interesting. The predictors are unacceptably large, even wildly unacceptable, during round one, but after the round one hurdle had been passed and it was just Macron and LePen left, the errors shrank rapidly and met our 2% threshold in all cases. Why is this?
One possible explanation is format flattery. We are using five-person-unforced 5PU format, so the fact that the second-round votes for Mélenchon, Pécresse and Zemmour defaulted to zero after round one (because they didn’t make it) meant that the average accuracy increased: if we had been using 2PU or 2PF things might have been different. Nevertheless the prosaic explanation may be the best one: simply put LePen just performed poorly in the second round and never seriously threatened Macron.
The tables below show WIN accuracy of the predicted vote shares in round two, and the predicted probability of winning round two.
Table 19: Mean WIN indicator for probability of winning round two at datum dates 1-7.
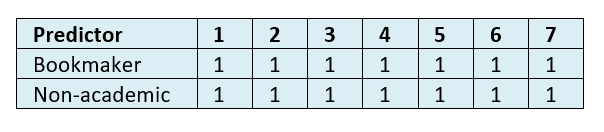
Table 20: Mean WIN indicator for predicted vote shares in round two at datum dates 1-7.
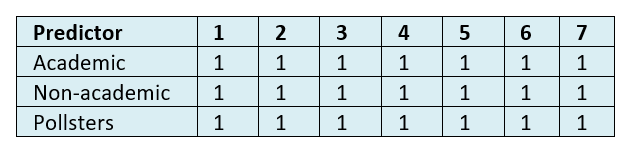
To ram the point home, at no point in the seven datum dates prior to the round two election did anybody seriously think that anybody other than Macron would win.
Conclusion
On an initial reading, this was a straightforward election. The multiplicity of candidates meant that prediction was difficult and the errors large, but as time passed and the competitors were winnowed down to two, the predictors stabilised and became useful.
But one interesting phenomenon did manifest: the abnormally large estimates for Pécresse in round two, which, on the face of it, were unjustified. It is plausible that Mme. Pécresse was actually popular in the early stages, and that would explain the predictions. But even up to datum date four (5 April, five days before the round one election) Hypermind was still saying Pécresse would do better than LePen in round two, despite the fact that she had no real chance of getting there. Investigating the reasons for this would be fascinating but outside the scope of this article.
About the author
Timothy Martyn Hill is a statistician who works in the private sector.
Disclaimer
To pass the compliance requirements of the author’s employer, please note that the author’s affiliation for this article is “independent” and the views expressed in this article are those of the author and in no way do they reflect the opinions of any entity or organisation with which the author is – or has in the past, or may in the future be – affiliated.


