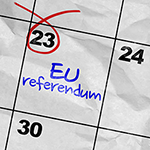
With so much riding on the outcome, politicians are inevitably paying close attention to polling to try to understand the effect of campaign messages. Pollsters, mindful of their failure to correctly gauge the General Election outcome last May, are interpreting their results cautiously whilst noting the difficulty in correctly assessing key aspects of this referendum. Votes such as these are held so infrequently in the UK, it is difficult to know exactly who will vote, and whether those who are still undecided are more likely to vote one way or the other.
However, there are past referenda we can look at – both within the UK and abroad – which can give some indication of the accuracy of previous attempts at predicting outcomes. Since 1972 there have been at least 42 referenda held on the European Union or associated bodies or predecessors. In the UK, referenda are held more rarely although they have become more prevalent in recent years.
For past European-level referenda we obtained opinion poll values for referenda held in Ireland in 2008, 2009, and 2012, Croatia in 2012, and the UK in 1975. We also obtained data for the UK’s referendum on the Alternative Vote in 2011, and for Scotland’s referendum on independence in 2014.
Having chosen our referenda, what methods were used to predict their outcome? What predictors were monitored, and what metrics can we use to measure how well they performed against the result?
-
Predictors. In a previous article we discussed predictors such as betting odds, models and polls: although polls are not formally predictors they have been used as such. To track predictors over time requires enough data points to make such tracking meaningful, so we will discard predictors with less than four points. Each predictor will be forced into a two-party-forced format: undecideds or don’t knows will be proportionally reallocated to the yes/nos. We use two-party-forced because polls may be reported in that format and raw polls may give ludicrously large “others”.
Predictors fall into broadly two types: vote share predictors and probabilistic predictors, predicting the percentage of the yes/no vote and the probability of a yes/no win respectively. Opinion polls are usually vote share predictors and betting odds are usually probabilistic predictors.
-
Metrics. Again, in that previous article we discussed error metrics such as root-mean-square-error (RMSE) and mean absolute error (MAE), and concluded that MAE would be the most appropriate to use because MAE or variants are understood by pollsters, bettors, and modellers. But the problem with using MAE and RMSE for referenda quickly becomes apparent: they measure the size of a prediction error but not its direction. For referenda we required a directional metric, since we need to differentiate between cases with the same MAE where the “yes” vote is underestimated and where it is overestimated. For this reason we will use the error of the “yes” lead for our metric. Error of the “yes” lead (or ELY) is defined as:
ELY = (“Yes” prediction – “No” prediction) – (“Yes” result – “No” result)
ELY requires that we must specify which option is “yes” and which “no” for each of the referenda being studied. This was done and the list is given in Appendix 12. Note that because we are using two-party-forced and the result is a constant, algebraically ELY is linearly proportional to the two-party-forced “yes” vote, and the magnitude of ELY is twice the magnitude of MAE (although the sign may differ). See Appendix 13 for the proofs.
-
Results. Unlike UK General Elections, the predictions for the UK-wide referenda will be measured against the UK results, not the GB results.
- Threshold. MAEs for UK General Elections are considered problematic if their MAEs are substantially above 2%. A MAE of 2% is equivalent to an ELY of +/- 4%, so we will use that +/- 4% band as our threshold for an acceptable ELY.
In summary, we will use the ELY metric to track the distance of predictors (such as opinion polls) from the final referendum result, and discover when (or if) they become acceptably accurate.
European referenda
The graph below depicts polling data obtained for our five European referenda. Specifically, the data shown are the percentage of “yes” votes for each poll. Polling organisations with polls published on less than four occasions are omitted. Referenda which ultimately voted “no” are shown with bold lines, those that voted “yes” are dashed.
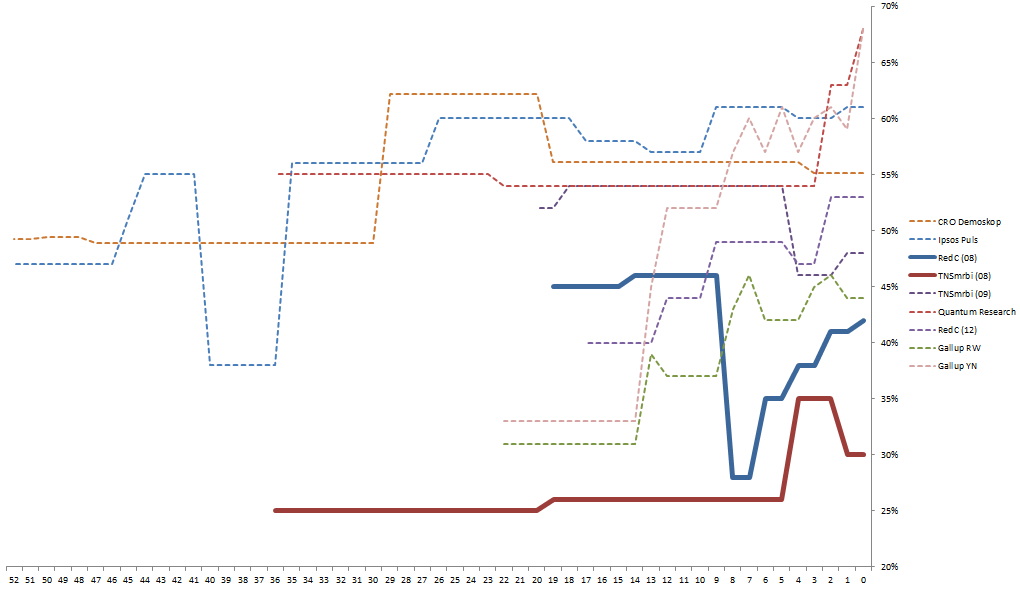
Figure 1. Raw “Yes” voters, not necessarily with redistributed undecideds, for a year prior to referendum. Note: X axis is number of Fridays before referendum. Words like “In favour” or “For” are interpreted as “Yes”
Looking at the data in this way isn’t really useful: arguably, we see that the proportion of “yes” voters rises with time, but you’d expect that as the number of “undecided” voters falls. Instead, let us look at the “yes” vote when the undecideds are redistributed proportionately into a two-party-forced format.
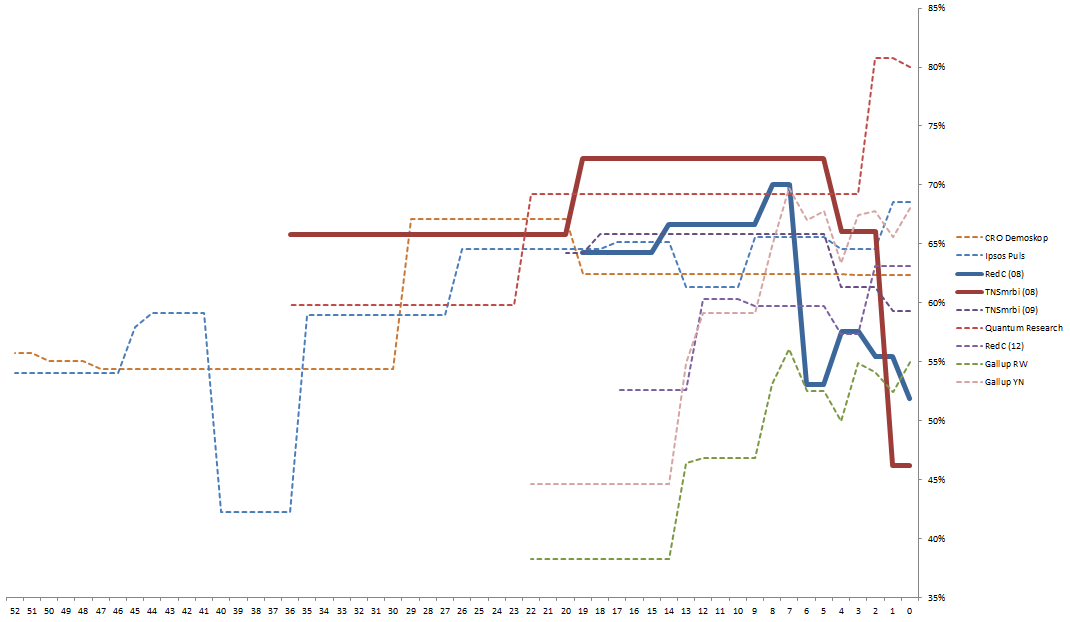
Figure 2. “Yes” voters, in two-party-forced format, for one year prior to referendum. Note: X axis is number of Fridays before referendum. Words like “In favour” or “For” are interpreted as “Yes”
This is perhaps a bit more useful: referenda that have “yes” voters scoring less than 55% in opinion polls immediately before the vote go on to lose .
Now let’s consider the ELY metric for these referenda, as depicted in the graph below.
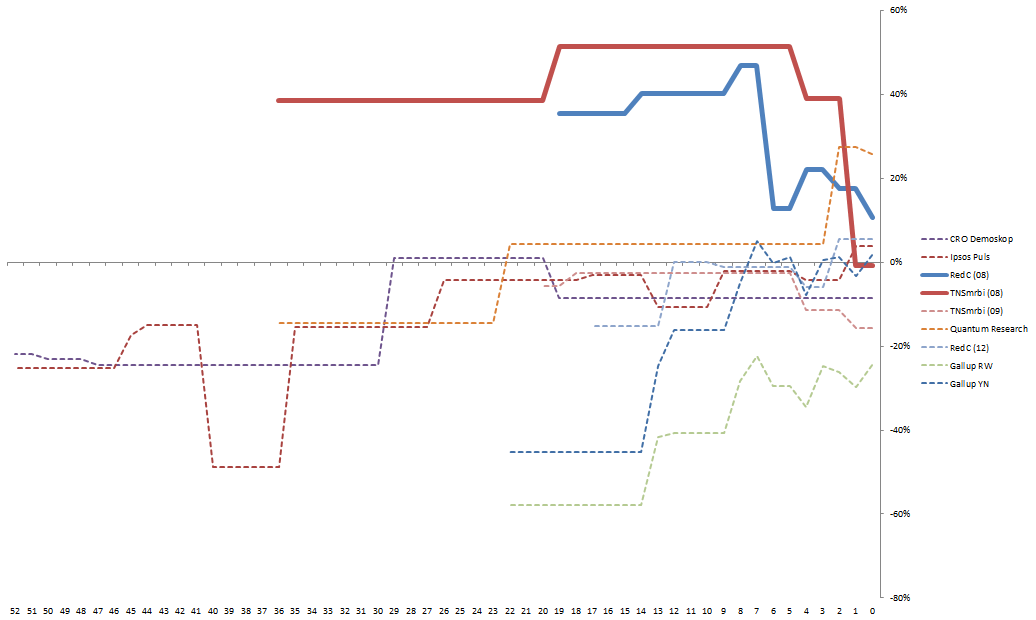
Figure 3. ELY of prediction in two-party-forced format, for one year prior to referendum. X axis is number of Fridays before referendum. Words like “In favour” or “For” are interpreted as “Yes”
We see that referenda that voted “no” were preceded by polls that initially underestimated the “no” lead, and referenda that voted “yes” initially underestimated “yes”.The polls converge as the campaign wears on but plainly many of them finish outside our acceptable ELY band of +/- 4%.
United Kingdom 1975
In the 1970s the Labour Party contained a substantial proportion of MPs, party members and trades unionists that did not want to join the (then) European Community, known as the Common Market. The UK had joined in 1973 under the Conservative government of that time, but when Labour returned to government in 1974, the Labour Prime Minister Harold Wilson renegotiated the UK’s relationship and submitted the results to the people of the UK on 5 June 1975. The referendum voted in favour by 67.23% to 32.77%
Several polls were published in the last days but Gallup had done so from six months prior. They polled on whether the UK was right or wrong to join, and whether people would vote to stay or leave.
The “yes” voters in two-party-forced format are depicted in the graph below. Polling organisations with polls published on less than four days are omitted.
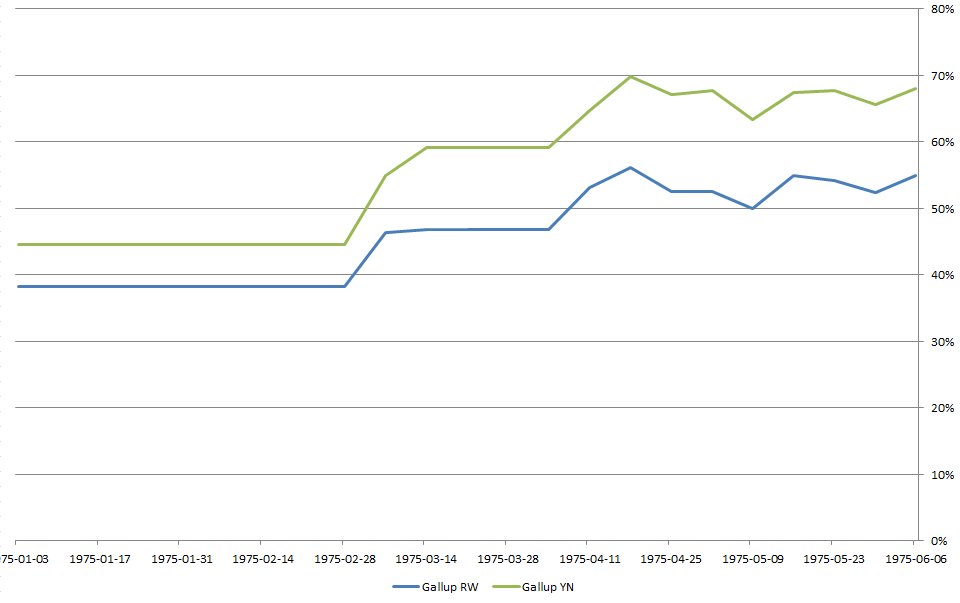
Figure 4. “Yes” voters, in two-party-forced format, prior to referendum. X axis is dates before referendum. “Right” and “Wrong”, “Stay” or “Leave” have been taken as “Yes” and “No
The ELY between each poll in two-party-forced format and the referendum result are below.
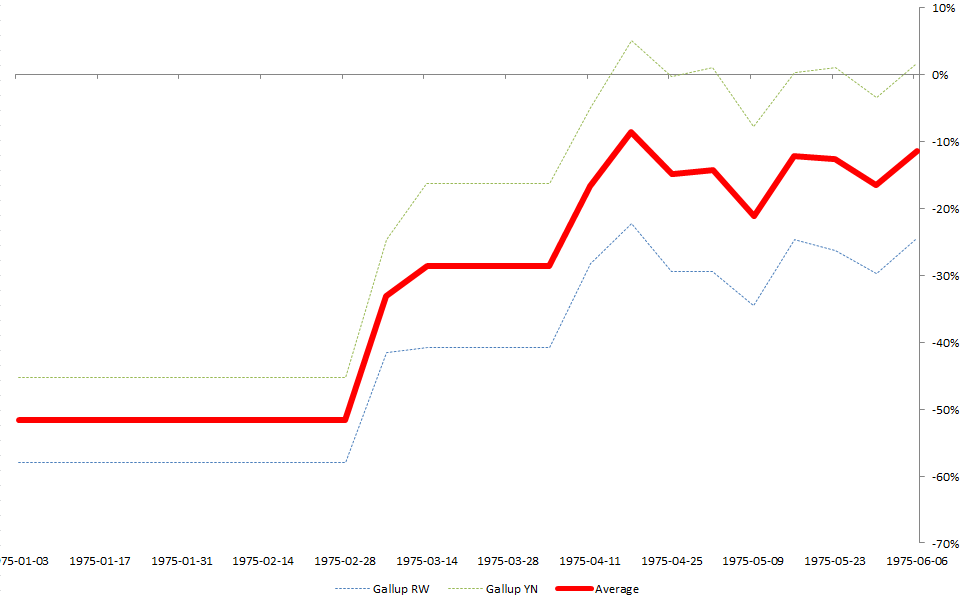
Figure 5. ELY of prediction in two-party-forced format, prior to referendum. X axis is dates before referendum. “Right” and “Wrong”, “Stay” or “Leave” have been taken as “Yes” and “No”
In Figure 4, we see that “yes” voters started 1975 low but increased steadily as the year progressed, eventually achieving a two-to-one ratio of “yes” to “no”. In Figure 5, we see that the ELY of the Gallup yes/no polls was large but converged to the result closely in the final weeks, easily falling within our acceptable band. The Gallup right/wrong polls (asking if the UK was right or wrong to have joined) were not as useful as a predictor, with an unacceptably large ELY throughout.
The ‘Alternative Vote’ vote
In the 2010 UK General Election, MPs from the Conservative Party won a plurality but not a majority. Instead of forming a minority government, the leader of the Conservative Party, David Cameron, offered a coalition to the Liberal Democrat Party, whose MPs combined with the Conservatives would be enough to secure a working majority. They concurred and an agreement was drawn up on what the Coalition Government intended to do. One of those intentions was a referendum to change the voting system for UK General Elections to the Alternative Vote system, sometimes known as Instant-Runoff voting. That referendum was held on 5 May 2011. The result was 67.9% No, 32.1% Yes.
The “yes” voters in a two-party-forced format are depicted in the graph below. Polling organisations with polls published on less than four days are omitted.
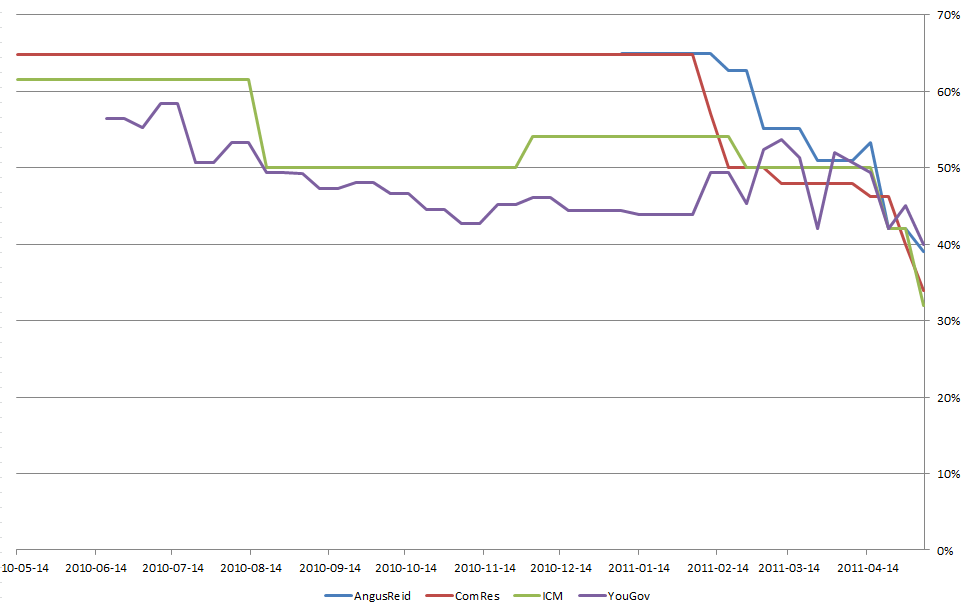
Figure 6. “Yes” voters, in two-party-forced format, prior to referendum. X axis is dates before referendum
The ELY between each poll in two-party-forced format and the referendum result are below.
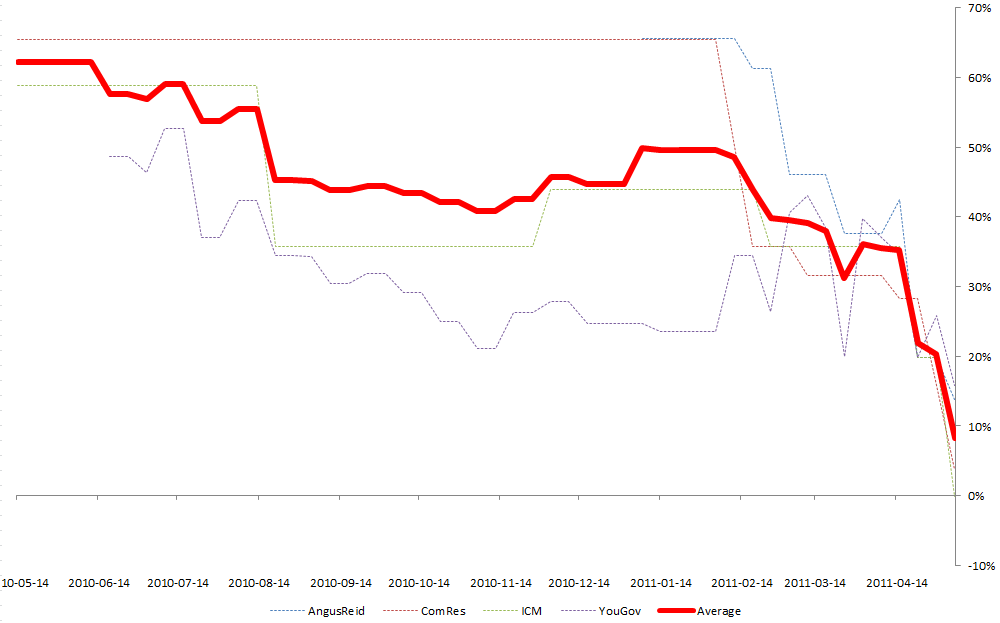
Figure 7. ELY of prediction in two-party-forced format, prior to referendum. X axis is dates before referendum
In Figure 6, we see that “yes” started high in the opinion polls but suffered a precipitous collapse as the referendum approached. In Figure 7, the ELY of the polls similarly was large but converged to the result in the final weeks, with the polling company ICM predicting the result almost exactly. Nevertheless, some ELYs were still unacceptably high, finishing well outside our acceptable band.
Scottish independence
In 2011, elections to the Scottish Parliament returned a majority for the Scottish National Party (SNP). This majority enabled an SNP government to be formed, and it wished to hold a referendum on whether Scotland should secede from the UK. The UK and Scottish governments negotiated a referendum, which was held on 18 September 2014. The result was 55.3% No, 44.7% Yes.
The “yes” voters in two-party-forced format are depicted in the graph below. Polling organisations with polls published on less than four days are omitted.
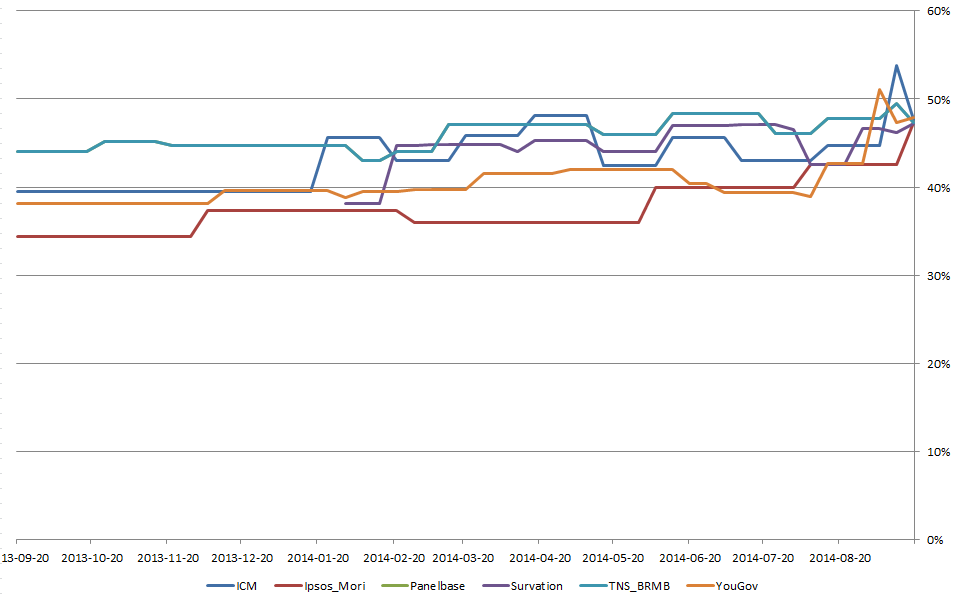
Figure 8. “Yes” voters, in two-party-forced format, prior to referendum. X axis is dates before referendum
The ELY between each poll in two-party-forced format and the referendum result are below.
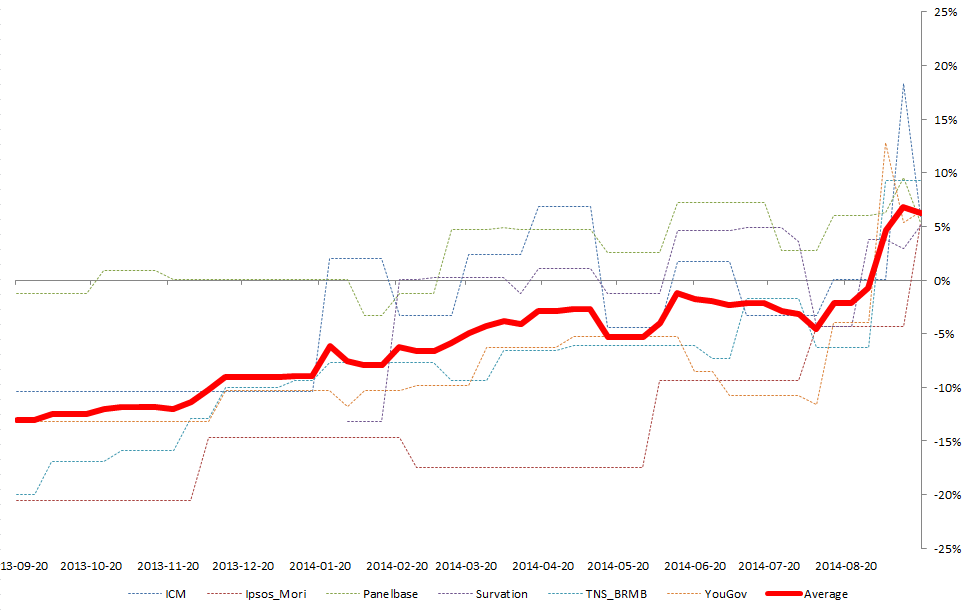
Figure 9. “ELY” of prediction in two-party-forced format, prior to referendum. X axis is dates before referendum
This referendum generated much heated discussion but in the end, little changed: as shown in Figure 8, the “yes” voters remained below 50% for nearly the entire campaign, breaking through only in the latter weeks and then only briefly. Again, the polls converge in the latter weeks, but again – in Figure 9 – the ELYs were unacceptably high.
Right or wrong?
So far, we have seen how predictors vary across time, converging to a (somewhat accurate) result as time progresses. But let’s slice the data in a different way: how did things look in each of our past referenda on the day of the vote? What did the final predictions say, whether published that morning or a week prior? The results are shown in Figure 10.
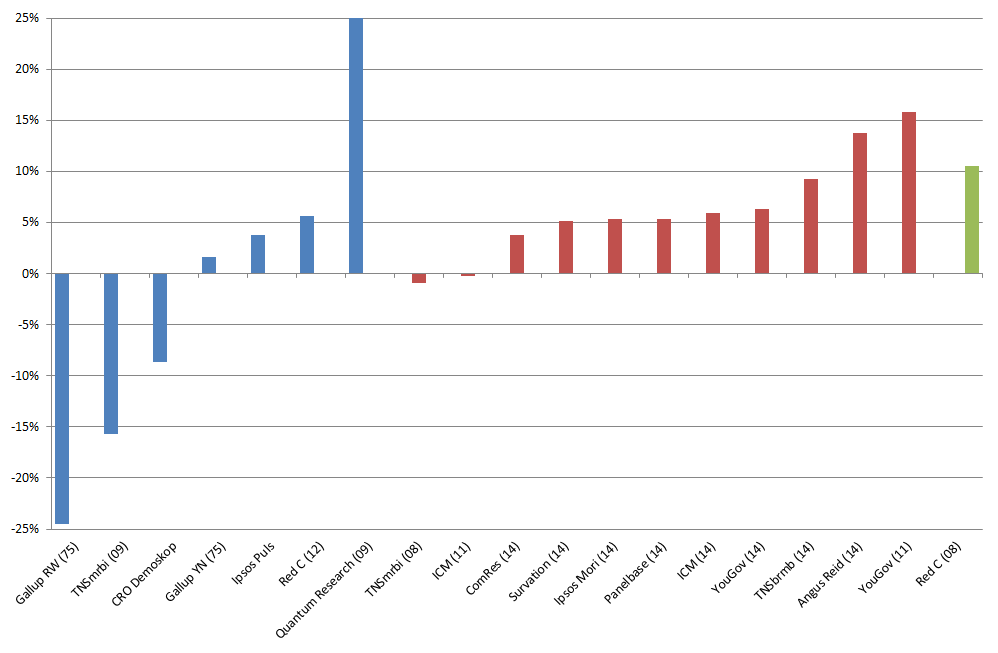
Figure 10. ELY of prediction in two-party-forced format for selected latest polls immediately prior the vote Y-axis is ELY. A positive ELY overstates “yes” lead (or understates “no” lead). A negative ELY does the opposite
In the graph above, blue indicates those polls that correctly predicted a “yes” win, red is the polls that correctly predicted a “no” win, while green incorrectly predicted a “Yes” win.
The results are not good. Nearly all the polls exceed the 4% error band, some by quite an amount. But since they all (except one) correctly predicted the winner, these errors did not invite too much comment.
However, as politicians and others pour over the results of polls conducted in the run-up to the UK’s June referendum, Figure 10 should provide some pause for thought. For the polls in our small sample, the “yes” vote was overstated more often than not, so surveys showing a small lead for the Remain camp might perhaps be guilty of the same.
The ‘Brexit’ vote
With the above points in mind, let’s finally turn to the polls, odds and model predictions for the EU referendum.
Opinion Polls
For 2016 referendum polls, we shall define the “Remain” lead as the two-party-forced “Remain” vote minus the two-party-forced “Leave” vote. The “Remain” lead for the latest opinion polls (as at 8 May 2016) are as follows:
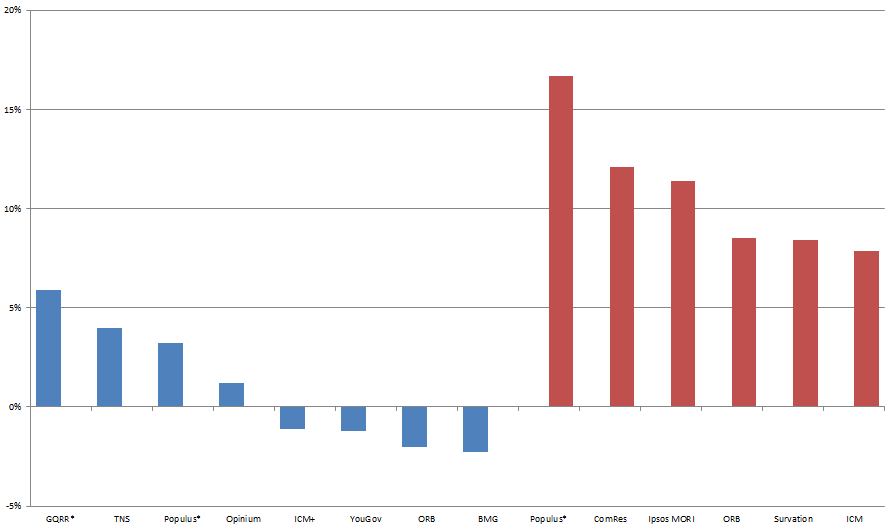
Figure 11. “Remain” lead, in two-party-forced format, as at 8 May 2016. X axis is each pollster. Blue are online, Red are phone polls. “*” denotes March, “+” May
The online and phone poll results are irreconcilable, with the online polls (in blue) showing no definitive lead for either side, while the phone polls show a distinct “Remain” lead. Suggested reasons for this difference include too many affluent and/or Labour voters sampled by phone, or too many engaged voters or UKIP voters sampled online. Authorities differ on how to cope with this phenomenon, with some splitting the difference, others believing phone polls are closer to the truth, and others simply not knowing what to do.
Bookmakers
Just as they did for the 2015 UK General Election, several bookmakers are offering a “book” (profferred odds on all outcomes of a given event) on the EU referendum. At the time of writing no book has odds on anything other than “Remain” or “Leave”, so the books are two-party-forced by default. Bookmakers use an “overround” which is a margin imposed to make the book exceed a probability of 100%. The existence of a positive “overround” enables the bookmaker to make a profit but it skews the probabilities derived from the raw odds. Those skewed probabilities are called “implied probabilities”. To compensate for this the overrounds have been removed, forcing the probabilities to sum to 100%. These probabilities are called “actual probabilities”.
The “Remain” lead for a given book for the UK vote is defined as the actual probability that “Remain” will win minus the actual probability that “Leave” will win. The “Remain” leads for the latest books at 8 May 2016 are given below.
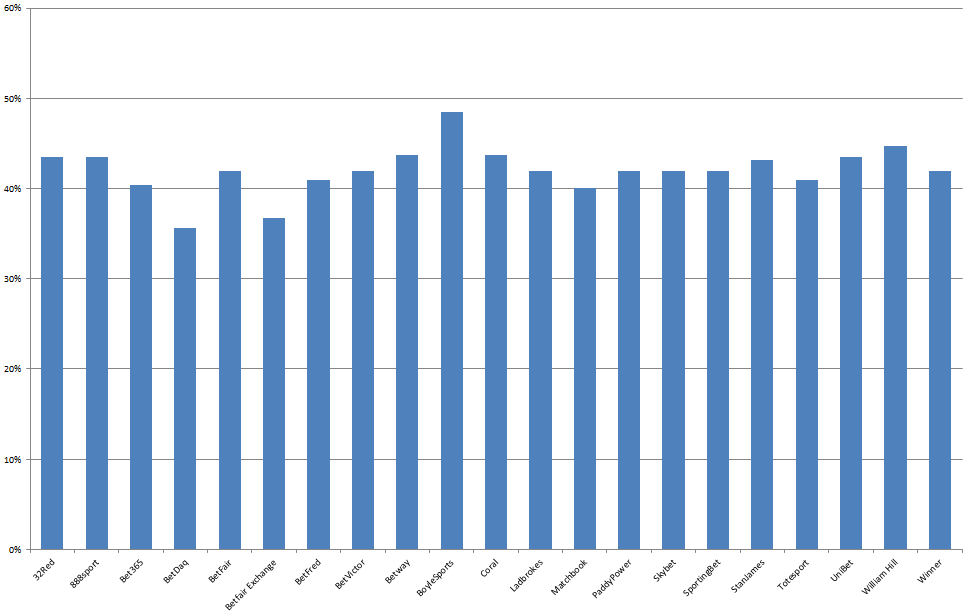
Figure 12. “Remain” lead for the latest books as at 8 May 2016. X axis is each bookmaker. Y axis is difference between actual P(Remain win) minus actual P(Leave win)
This figure shows the amount by which the probability of "Remain" winning exceeds the probability of "Leave" winning. But that’s not the same as the probability that "Remain" will win by that amount – a large probability that “Remain” will win is not a probability that “Remain” will win by a wide margin. This figure does not depict the probable size of the lead; it shows the size of the probability lead.
But even given that caveat, this is unambiguous: every book thinks the probability that "Remain" will win is at least 35 percentage points larger than the "Leave" probability. However, betting odds are a poor predictor, with one bookmaker paying out early on the wrong result for both the Greece July 2015 and Ireland 2008 referenda.
Modellers
As there was for the 2015 UK General Election, there is a group of modellers making predictions on the referendum result. At 8 May 2016 we have obtained data from five of them: three vote shares and two probabilistic predictors. The “Remain” leads in two-party-forced format for each predictor are depicted in the graph below.
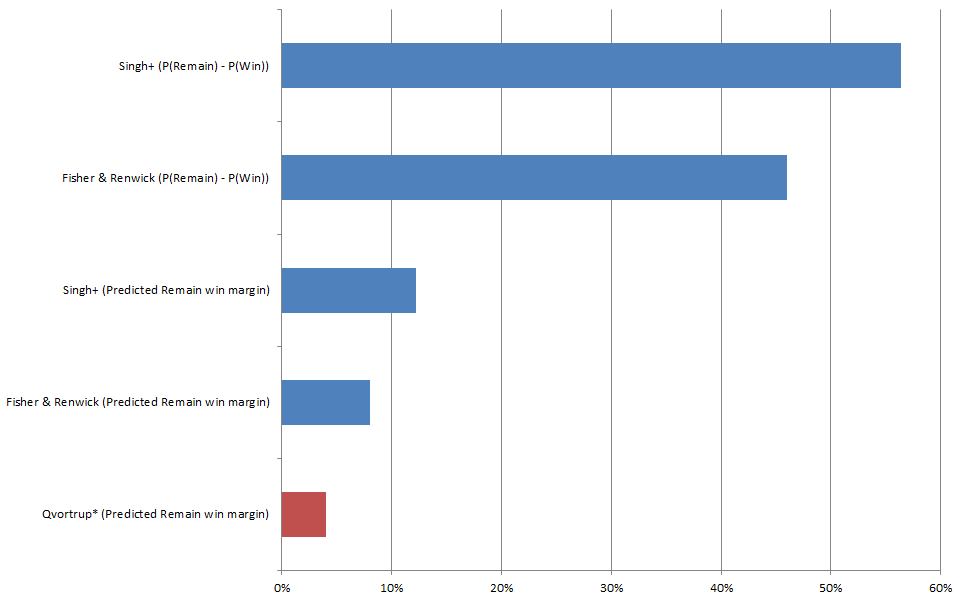
Figure 13. “Remain” lead, two-party-forced for latest model predictors, as at 8 May 2016. X-axis is “Remain” lead. Blue are poll-based, Red are non-poll-based. “*” denotes March, “+” May
The predicted vote share leads for “Remain” are between 4% and 12%. The predicted probabilities of “Remain” winning are estimated to be over 45 percentage points greater than “Leave”.
The modellers are Professor Stephen Fisher (Trinity College, Oxford) and Dr Alan Renwick (Constitution Unit), Matt Singh (founder of Number Cruncher Politics), and Professor Matt Qvortrup (CTPSR, Coventry). Note that Qvortrup’s model is not poll-based.
In the 2015 UK General Election, poll-based models were susceptible to errors in the polls. Lebo and Norpoth had a robust non-vote-share model that might have accurately predicted that election but they modified it to take account of the Coalition. For this reason we have separated out Qvortup’s non-poll-based model from the poll-based models.
Other
We have covered polls, betting odds, and models. But Stephen Fisher and Rosalind Shorrocks, a Masters student at the University of Oxford, identify other predictors and categorise them as follows:
- Citizen forecasts: surveys of voters, asking them what they think the outcome will be.
- Expert forecasts: forecasts by experts e.g. the Times Red Box sweepstake podcast contributors.
- Volunteer forecasts: forecasts by volunteers, e.g. Philip Tetlock’s Good Judgement project
- Prediction markets: a market where people bet on an event with each other, with the odds being set automatically from moment to moment by supply and demand, not by a human bookmaker.
Using their own collation methods, Fisher and Shorrocks have pooled these other predictors into a single website. The results at 8 May 2016 are:
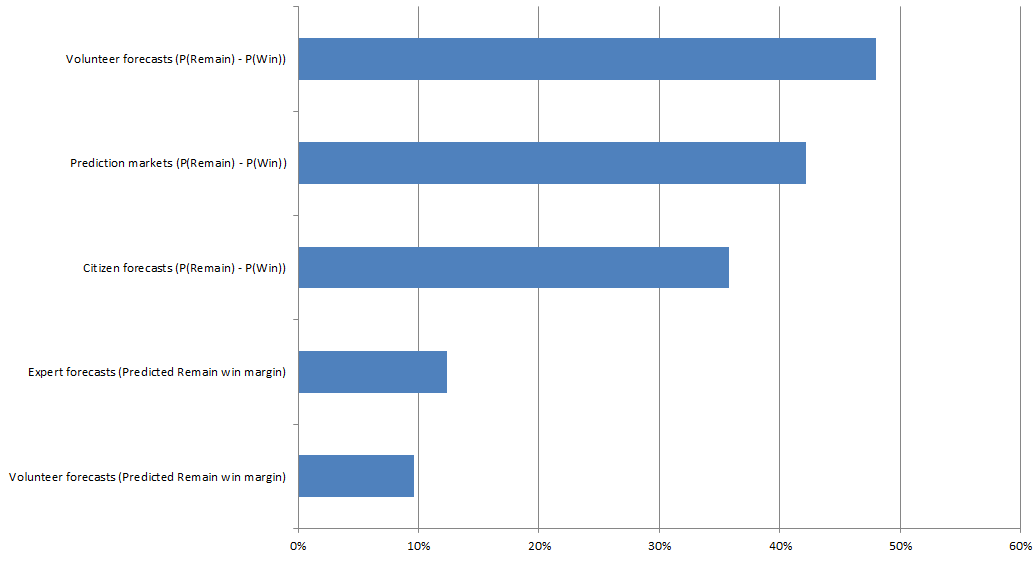
Figure 14. “Remain” lead, two-party-forced for Fisher/Shorrocks collated predictors at 8 May 2016. X-axis is “Remain” lead
The predicted vote share leads for “Remain” are between 10% and 12%. The predicted probabilities of “Remain” winning are estimated to be over 35 percentage points greater than “Leave”.
Conclusions
At this point in time, most predictors seem to be pointing in favour of “Remain”. Will this be the ultimate result? It is hard to say for certain. Our brief look at the performance of the polls in past referenda suggests that they are much better at predicting the overall outcome than they are at predicting the exact share of the vote. But in a tight race, the tendency to overstate vote shares might lead to a false sense of security. We have seen that the online opinion polls are neck and neck, while the model vote share predictors and phone polls show a “Remain” lead, but one should bear in mind the wider prediction error.
The betting odds would have you believe that the vote is a foregone conclusion: that the UK will remain in the EU. But caution is still advised.
- Click here to download a version of this article, with inline references and appendices.
- Timothy Martyn Hill is a statistician who used to work for the Office for National Statistics and now works in the private sector.


