
In 1979, Mr Tony Barlow was interviewed by the BBC. He had a nice house in the suburbs, two cars, four children and a wife with a long bowl-cut. He also had a gambling habit: a big one. He’d bet £30,000 at 4/9 that the Conservative Party was going to achieve a majority at the 1979 UK General Election.[0707a] The average price of a house at that time was £19,075.[0416e] He seemed relaxed when speaking to the interviewer, and later bet more money.
He won.[0416f]
Welcome to the world of political betting in the United Kingdom. It is a discipline with showmanship. It excites passions and disapproval. It involves misdirection and elision, great study and great neglect. It is fervently believed and yet disdained. And this article attempts to describe it. In particular, we want to determine whether “odds” offered on election outcomes are a decent predictor of said outcomes.
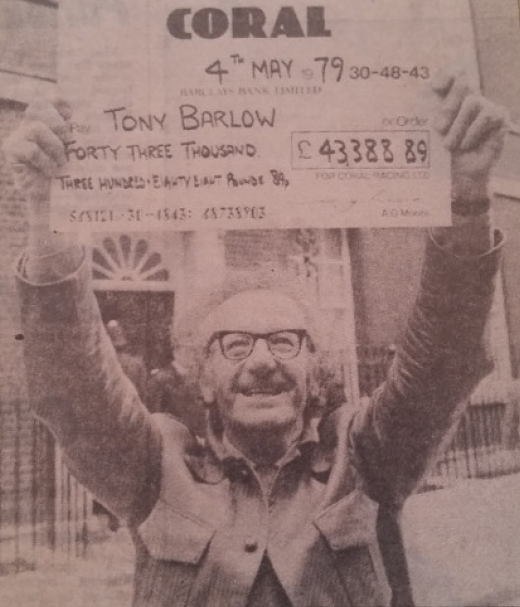
Above: Tony Barlow holding aloft his winnings from Coral following his £30,000 bet on the Conservatives winning the 1979 election. Photo from the Sidmouth Herald website, published 28 July 2016.
The odds are the ratio of the money staked on an outcome to the profit if the outcome occurs, and it can be rendered as a probabilistic prediction. For example, Mr Barlow’s fractional odds 4/9 bet on a Conservative victory can be converted to a probability of 9/(4+9) = 9/13 = 0.692 (or 69.2%).
Clearly, the odds offered to Barlow reflected the expectation that a Conservative victory was more likely than not. However, if the party had not won a majority, it would be incorrect to say that the odds were somehow wrong. So, we need to address the question: how exactly do we assess the goodness of a probabilistic prediction?
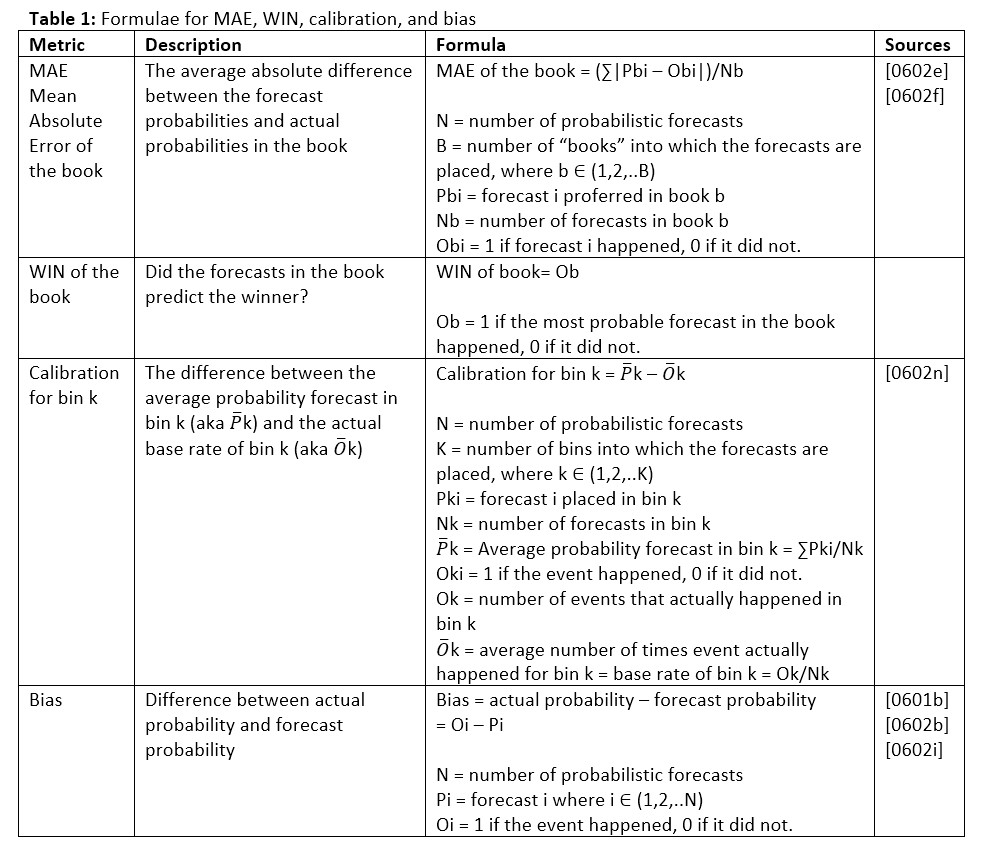
In previous articles in the Forecast Error series, we have used mean absolute error (MAE) and our own WIN metric (a simple binary value of whether a predictor predicts the winner or not). To retain compatibility with those articles we will continue to use these measures. We will also measure “bias” – whether or not the odds over- or underestimate a particular party – and “calibration” – which tells us whether, say, odds given an 80% chance of victory are right 80% of the time.
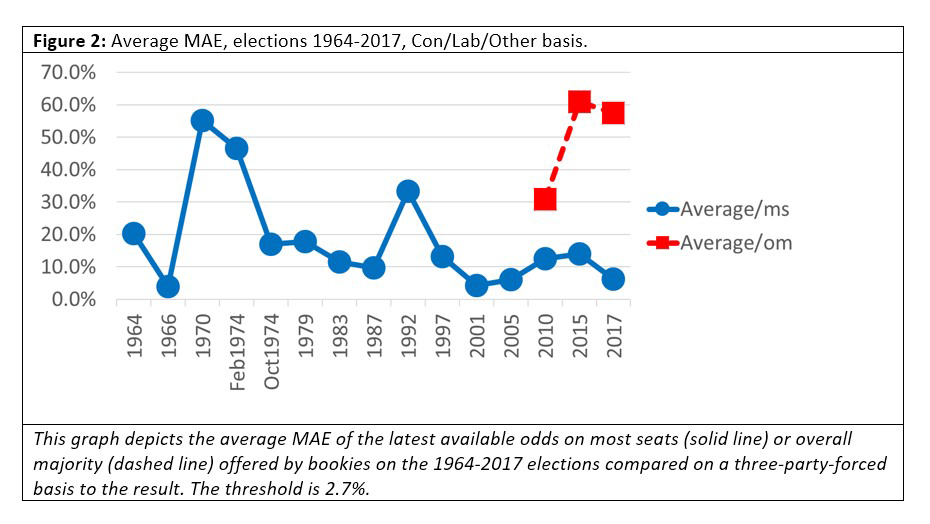
Meanwhile, to provide a consistent measure of accuracy across elections, we will evaluate predictions using the three-party-forced format, calculating MAEs based on predictions versus results for the Conservative Party (Con), the Labour Party (Lab), and all other parties (Other).
Finally, we must set our threshold for predictor performance: the point at which we separate a good prediction from a bad one. In a previous article[0819a] we discussed thresholds and noted that polls were judged using a 2% MAE threshold for four-party-forced, which equates to a 2.7% MAE threshold for three-party-forced. So, we will use 2.7% or less as our threshold for MAE three-party-forced for this article. For WIN, performance will be simpler to assess: did a majority of the odds predict the correct winner?
We will not impose a threshold on bias but will instead describe it. This is because, in modern days, bookmakers dislike[0819b] setting very short odds and very long odds, and the days when a bookmaker like Ladbrokes would offer 50,000 to 1 against the Liberals winning the election, as it did in 1964,[0709x] are long gone. This imposes a structural bias on odds, so that even events with an extraordinarily low/high probability will not be assigned extraordinarily long/short odds.
At this point we have four metrics: MAE, WIN, calibration and bias. Is this excessive? This article must cope with three tensions: the tension between the individual and the aggregated, the tension between clarity and continuity, and the tension between experts and the public. Individual elections need individual measurements but groups of elections require aggregated ones. Clarity demands few metrics, but continuity to other articles demands more. The public require simple measurements, but professionals want more complex or obscure ones.
Our four metrics – MAE for individual elections, calibration for aggregates, WIN for clarity, and bias for the professionals – meet these contradictory requirements. They are not perfect – MAE is sensitive to number of forced parties; calibration is sensitive to category selection – but collectively they are a good compromise. Their formulae are given below.
A brief history
Before we get to the analysis of predictors and performance, it is worth knowing a little about the history of gambling and political betting in the United Kingdom. There are fascinating stories to be told, dating back to at least 1190 (and for a full discussion of these, see the companion article, “The history of political betting”). However, for our purposes, the early twentieth century is when political betting started to take on a familiar form.
In the early 1900s, the London Stock Exchange (LSE) was trading in “majorities”, instruments based on the size of the government’s majority after the election. They were tradable and acted as a futures market. But the market collapsed after the 1931 election because the resulting government majority of 493 was so large that some lost considerable sums. The LSE then modified Stock Exchange Rule 93 to read: “A member shall not deal in prospective dividends or ‘Majorities’.” And that was the end of that.
During and immediately after World War II, betting on elections was little reported on, with few quotes appearing in the newspapers for the 1945 and 1950 UK General Elections. At the time, The Economist stated that “it is curious that in a nation devoted to gambling as the British, so little opportunity should nowadays be taken of a general election, the most sporting of all events”. But this was naïve: the public were gambling, just not publicly so. People with credit could bet via telephone and postal betting, and those without credit used illegal shops via a network of runners. But things were about to change.
Royal Commissions were set up in Great Britain and Northern Ireland and betting shops were legalized in 1958 (NI) and 1960 (GB) with licenses granted in 1959 and 1961, respectively. Betting on political events now became trivially easy, and politicians and bookmakers started to work political betting for publicity. In 1973, for example, the Liberal candidate Clement Freud placed several bets on himself and brought the odds down, which generated the media coverage that helped him get elected. Freud then bet on the 1979 general election and obtained a six-figure return.
Over time, political betting diversified, moving from high-street bookmakers to other modes. By 1987 the spread betting firm IG Index was offering spreads, as was Sporting Index by 1992. Later, as the internet and e-commerce developed, new forms of online gambling emerged. There were online sportsbooks such as sporting-life.com (later BetOnline.co.uk) and bet365.com, and online exchanges such as Betfair Exchange, Global Betting Exchange (later BETDAQ) and Flutter. Political betting has continued to grow and develop since.
UK accuracy by election
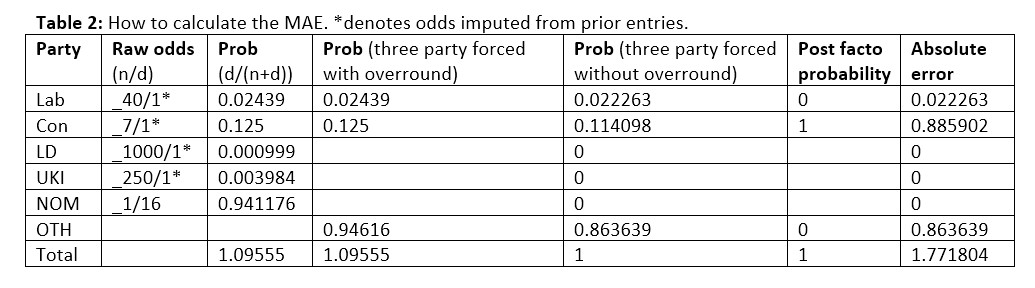
From all this betting activity, we can compile statistics for the 1906-1931 majorities market and the 1964-2017 elections. We converted the books for each election to three-party-forced, being careful to remove the overround, and calculated the MAE for each book. Here is an example of such a calculation for the Coral book of odds of 06/05/2015.[X718i][X718ag][X718s][X718ao][X718bb] The MAE of this worked example on a three-party-forced basis without overround is 1.771804/3 = 0.591.
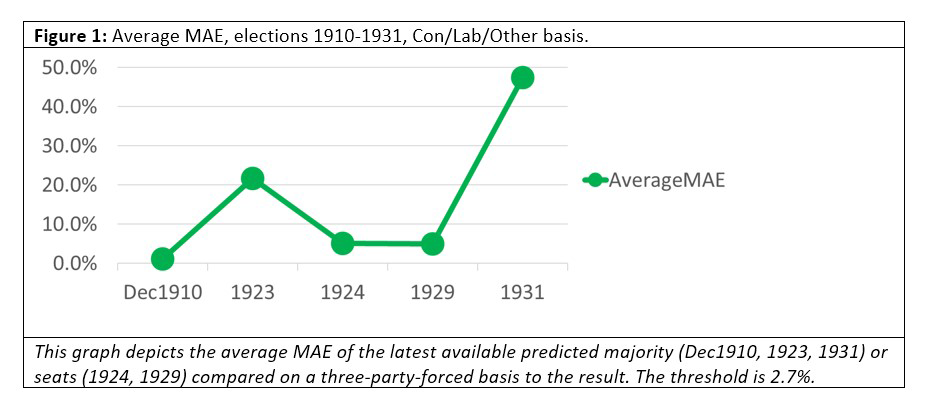
We calculated the average MAEs of the book for each election and plotted them on the following graphs. Note that Figures 1 and 2 suggest betting odds perform poorly. Only in one of the previous elections that we considered did the MAE come in under our 2.7% threshold: that was for December 1910, with a predicted government majority of 130 against an actual seat total of 122, an error of eight seats, which is approximately 1% of the 670 seats in the House of Commons at the time.
 But how about MAEs between modes? Are fixed-odds better than exchange betting? We show the MAE of the book for each bookie in Figure 3.

Betfair Exchange is a betting exchange, but the other three bookies are sportsbooks. One might expect Betfair to be more accurate, given the faster pace at which odds can change on a betting exchange. However, that is not apparent from the data: Betfair’s MAE on the odds on which party would win most seats was the best in 2017, but it was not consistently and noticeably better over elections, nor was it better for odds on which party would win an overall majority. We must note, however, that we did not consider inter-day variation, and that may yield a different conclusion when examined.
Next, we consider the WIN metric. Did our betting odds predict who would win? Here is an example of such a calculation for the 06/05/2015 Coral book of odds.
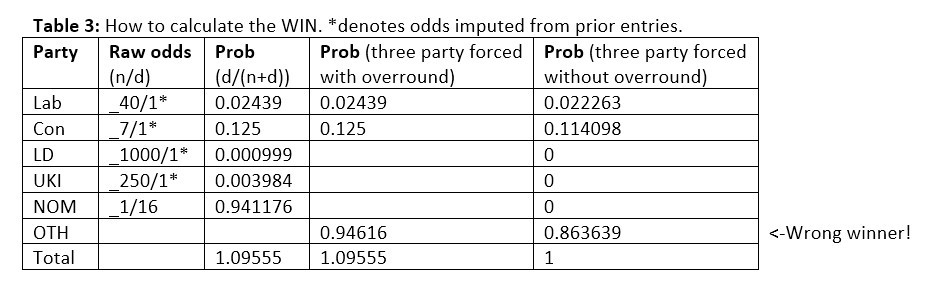
This worked example did not predict the winner, because Con won an overall majority in 2015 but the highest probability in the book was for OTH. So, for this book at that time, we set WIN=0. We calculated the average WINs for each election and plotted them on the following graphs. Figures 4 and 5 present a mixed picture, but one that is considerably better than for MAE.
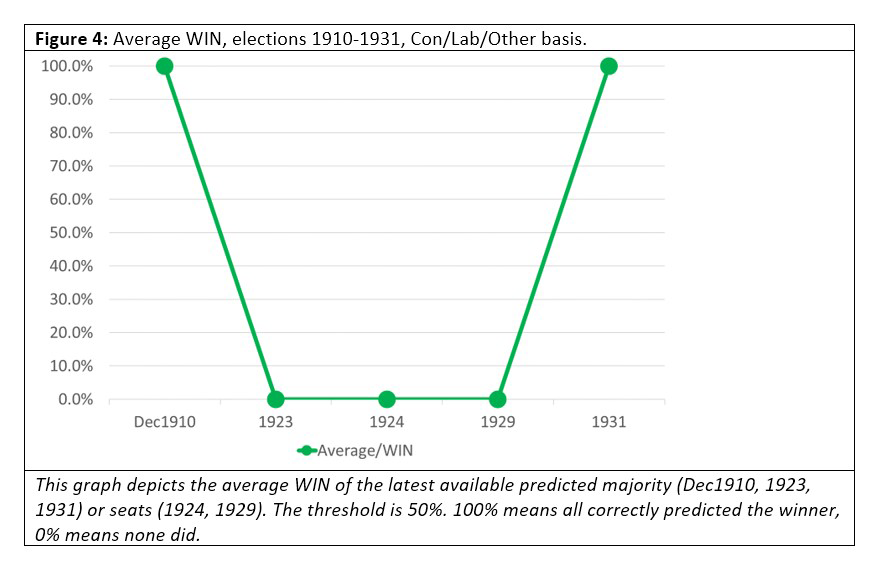
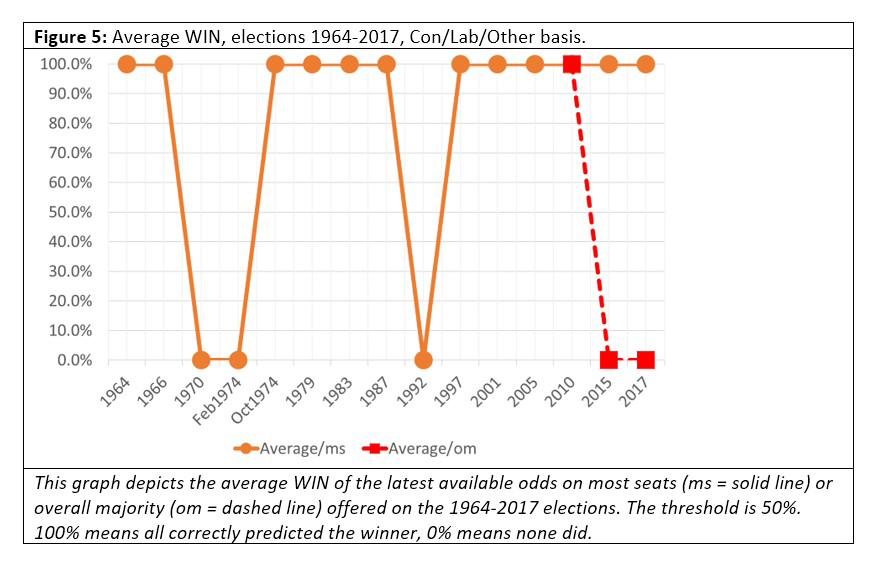 Here we see that the betting odds correctly predicted which party would win the most seats in 14 of the 20 elections covered by our time period (although predictions of who would win an overall majority were less good, at just 1 in 3). Presumably, these results account for the good reputation that odds enjoy among the public, but it should be noted that the odds offered by bookmakers are tightly coupled: they succeed or fail together.
Bias of the individual odds
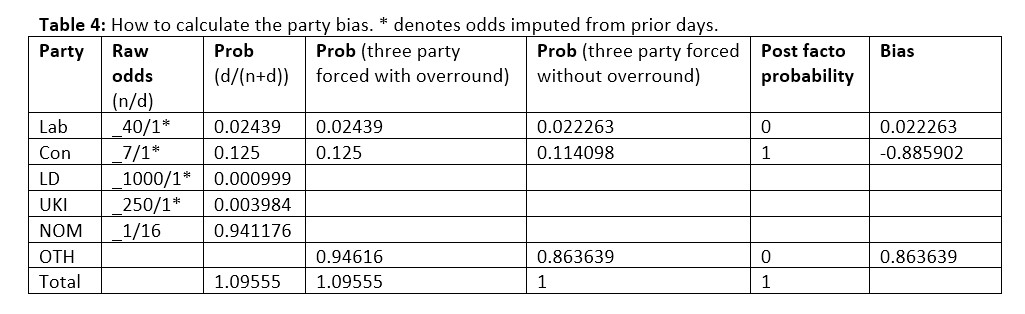
Now let’s consider bias. Do the betting odds over- or underestimate a particular party’s chances of victory? Here is a worked example of such a calculation for the Coral book of 06/05/2015. For this worked example, the bias for Lab was 0.022, for Con -0.886, and for OTH 0.864.
We calculate the average biases for each party and election and plot them on the following graphs.
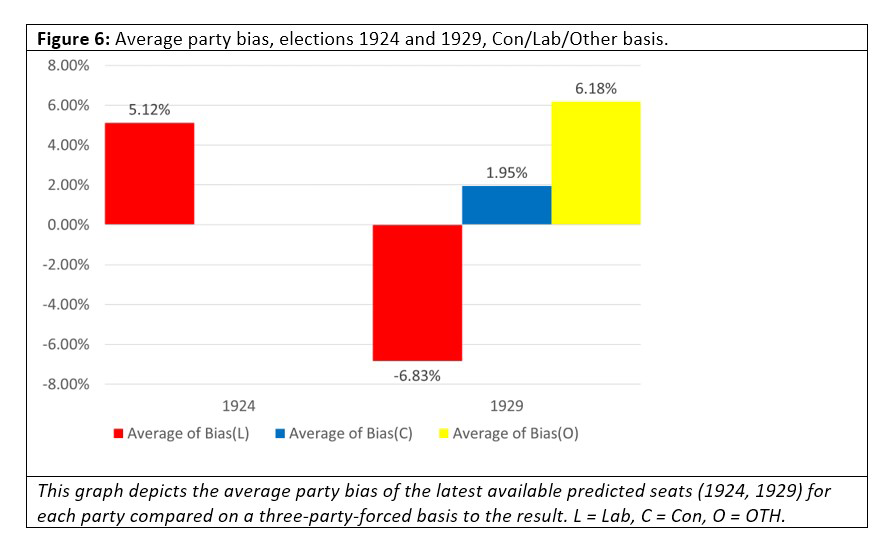
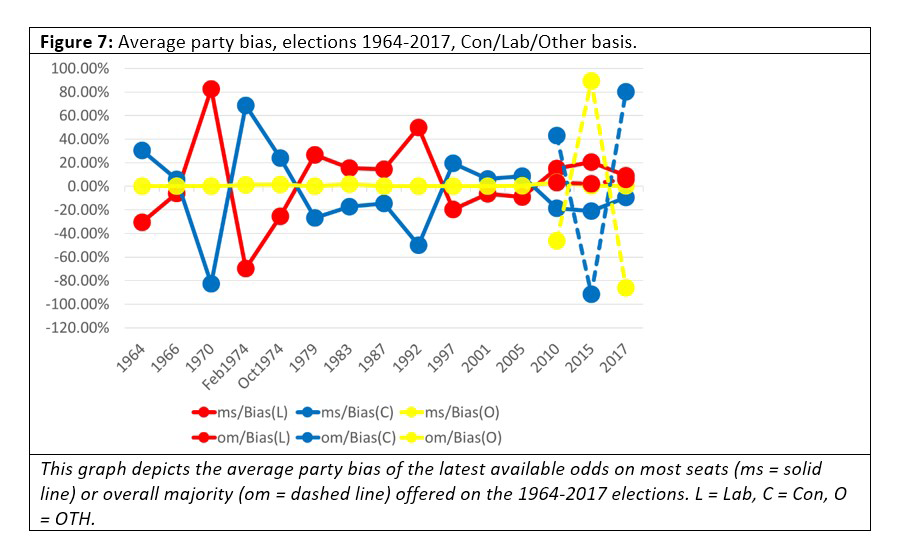 Looking at Figures 6 and 7 we note that, perhaps contrary to intuition, the odds are not biased in any particular direction, although the bias for “Other” is considerably less than the bias for the Labour or Conservative parties. Sometimes the bias is enormous, though. In 1970 the odds of the Labour party winning most seats was 1/10, a raw probability of approximately 91%, but Labour lost the election.
What about victor bias. Do we over- or underestimate the party that’s going to win?
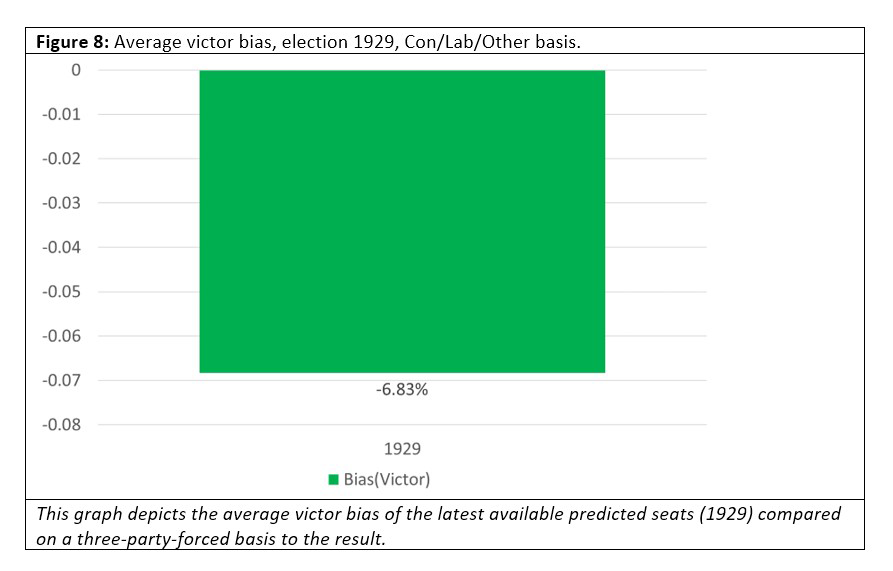
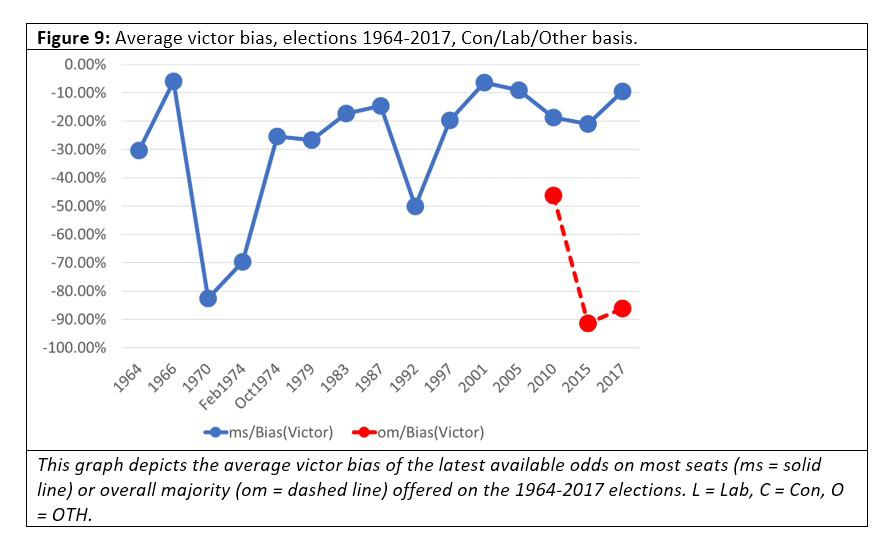 Figures 8 and 9 show that the odds consistently underestimate the probability of the eventual victor winning, sometimes hugely (as in 1970).
Calibration of the individual odds
Earlier, we used MAE to judge the distance between the prediction and the actual outcome. But that’s not the only way to judge probabilistic predictions. Instead of considering a single prediction deterministically, we can also consider several predictions “frequentistically”. Or, to put it more simply, we ask: Are our predictions of a 75% chance of victory right 75% of the time? Answering this question involves a process called “calibration”.
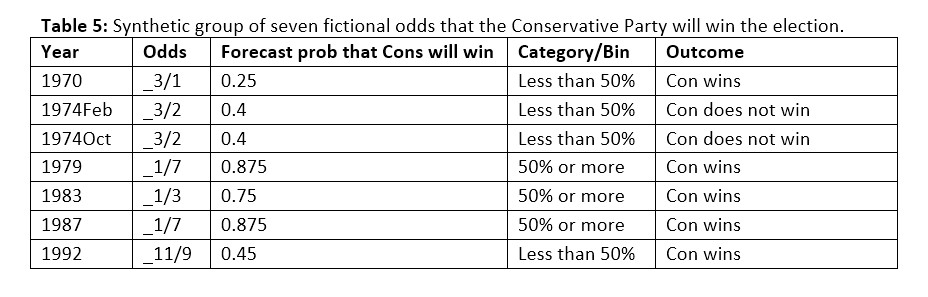
Calibration is a measure of the success of probabilistic predictions: for example, if you say that there is a 30% chance that party X will win, and 30% of those predictions are correct, then the prediction is well-calibrated. But “well-calibrated” is not the same as “accurate”. An example calibration calculation goes like this. Consider a synthetic group of seven predictions that the Conservative Party will win the election, from 1979 to 1992.
When the predictions are put into two bins, “Less than 50%” and “50% or more”, the table looks like this:
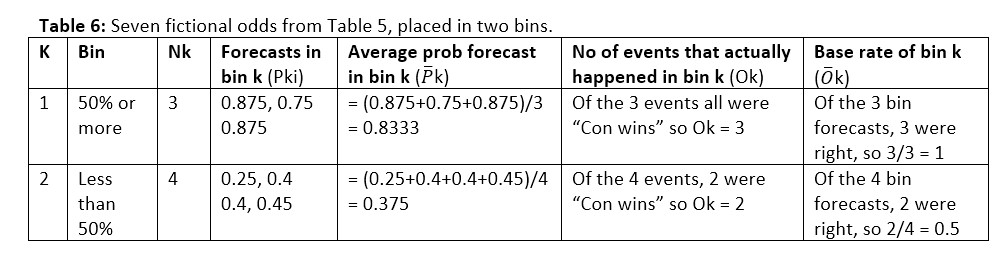
These two pairs (Category “50% or more”, base rate 1) and (Category “Less than 50%”, base rate 0.5) can be plotted on the x-axis and y-axis respectively of a graph.
We calculated the base rates for each bin and election and plotted their calibration pairs on the following graphs. The observed success rate for each bin (the “base rate”) is plotted on the y-axis against predicted success rate (the midpoint of the “bin”) on the x-axis.[0908a] These plots are called “reliability diagrams”, “calibration curves” or variants (not to be confused with the similar ROC curve). Figure 10 gives the reliability diagrams for the latest available odds offered on all elections from 1964-2017.
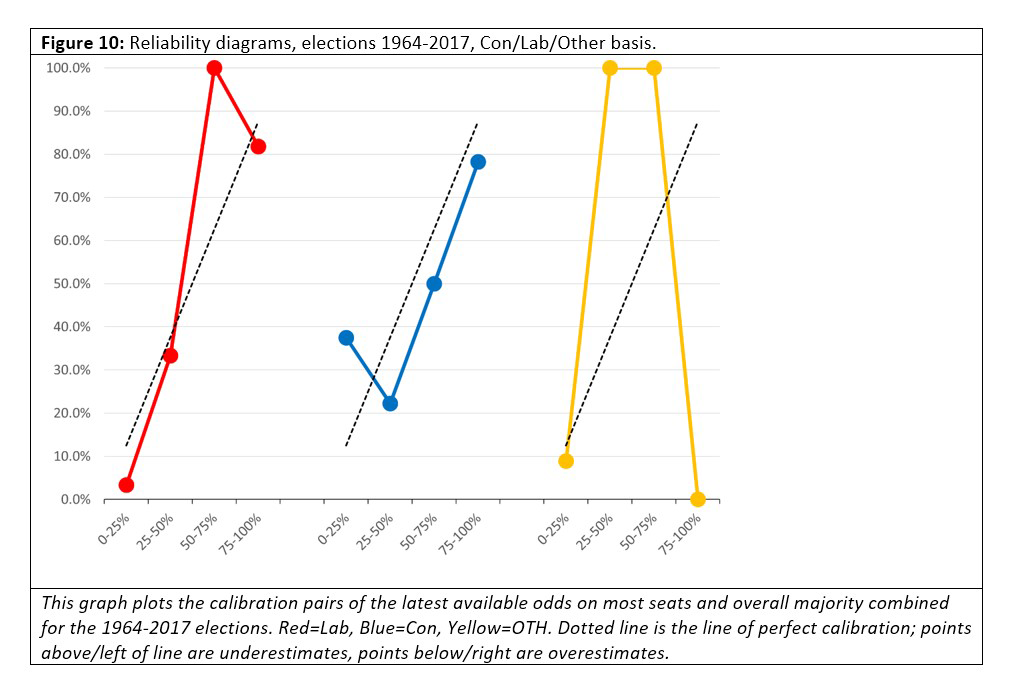
Labour and Conservative odds are pretty well calibrated, it seems, with some obvious exceptions (Labour odds in the 50-75% ranges are underestimates, as are Conservative odds in the 0-25% range). But the obvious problem is the “Other” (Lib majority, no overall majority, etc) category: these odds seem very unreliable.
This unreliability may be a genuine phenomenon or it might be an artefact of the three-party-forced format. Another possible cause may be the fact that we combined the most seats and overall majority odds in order to get enough numbers. If we had enough data to consider each separately, we may have seen something different.
Accuracy in the run-up to elections
The above discussion looks at the performance of odds at elections over time. Now, we will focus on just two recent elections and focus on how the odds evolved over time in the period leading up to each election. Our first election is the one that was held on 7 May 2015, which produced a Conservative overall majority. Our second election was held on 8 June 2017 and produced a hung parliament, with the Conservatives on most seats but without an overall majority.
Our first question is: Do books become more accurate as the election campaign progresses? The belief among gamblers that it does underlies the betting technique known as “value betting”, which says that if the odds on an event are wrong, then they will converge to the real odds as the date of the election gets closer. But do books exhibit this behavior? Do they converge to zero “error” as time to election reduces? Take a look at Figures 11 and 12, which track the MAE of the odds against final outcome over the final 30 days of the 2015 and 2017 campaigns.
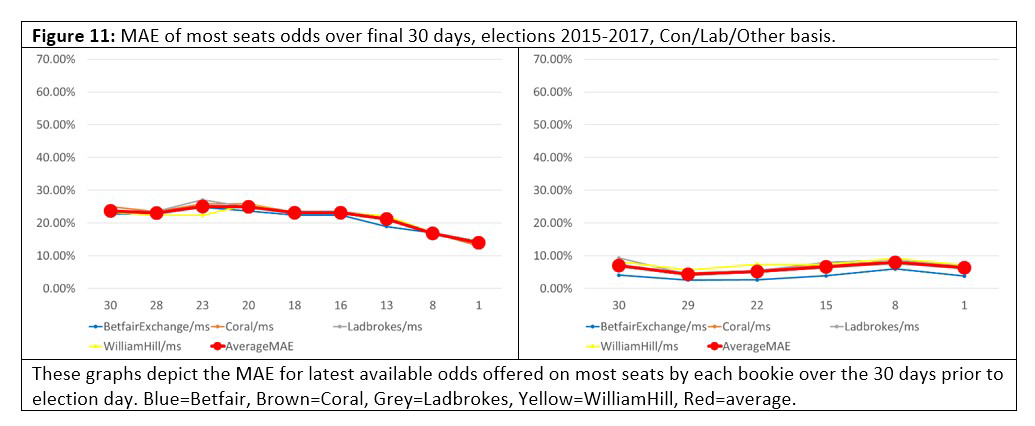
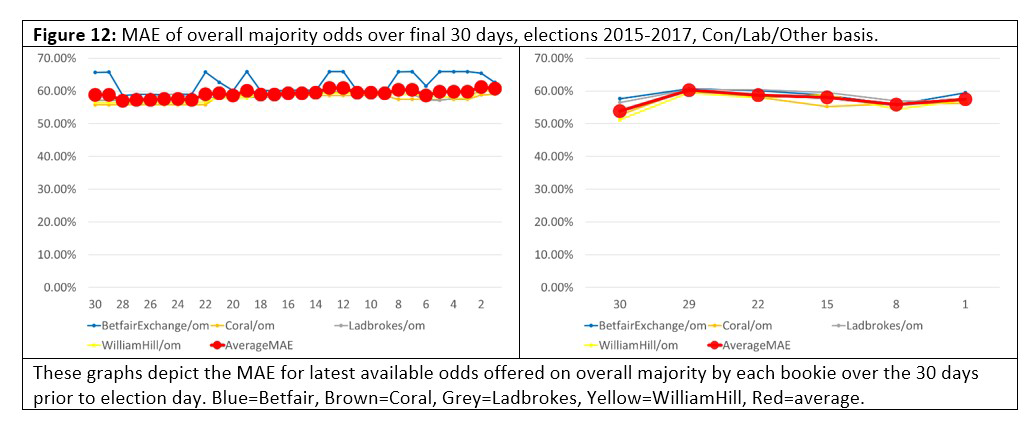 The “most seats” books exhibited the expected behavior, with a MAE either descending towards zero as the campaign proceeded, or to a lower MAE than at the start. But in both elections the “overall majority” had an MAE that got slightly worse as time went on. Again, this may be a genuine phenomenon or it might be an artefact of the three-party-forced format, or a quirk of 2015 and 2017.
Public perception
The general public and the media believe that gambling odds are the best indicator of electoral outcomes. The less-informed will cite a belief that odds are more reliable because people are betting their own money. The better-informed state that a perfect market and information will lead to an optimal solution. Phrases like “their own money”, “wisdom of crowds” and “smart money” will be bandied about.
Bookmakers are adamant that their odds are good predictors. Consider the following statements from Ladbrokes and Coral personnel:
“…The odds are arguably the most accurate predictor of what will happen on the 7th May [2015], as they are driven by hard, often informed, cash being invested, then our traders add in other factors like opinion polls to finalise those price …” – Simon Clare, Coral, 15 April 2015[0814a]
“…In the European elections…our odds were a better predictor of what the final scores were going to be for the parties than the polls were, and I suspect we’ll see something similar at this election…It’s always good to pay attention to where the money’s going: that discipline of having to put cold, hard cash down is often a very good predictor of what the result’s going to be…” – Matthew Shaddick, Ladbrokes, 5 January 2015[0814b]
Professional gamblers hold a different view. It is known that gambling markets can be manipulated: Clement Freud did it routinely, and the infamous “Trader B” spent seven million dollars keeping Romney’s odds short on Intrade[0819e] for the United States presidential election of 2012.
But even if the odds of an event are unmanipulated, that doesn’t stop them being wrong. In his book,[0505d] Mike Smithson of PoliticalBetting writes of the Dunfermline by-election of 9 February 2006. This election is notable because the odds pointed to the wrong winner right up to the very last moment: the odds showed Labour in the lead at 12:29 a.m. on the 10th, but a few minutes later, at 12:32 a.m., the Liberal Democrat candidate was declared the winner.[0505d] Smithson had this to say about the predictiveness of odds:
“…One thing that really annoys me is when people start suggesting that betting prices are the best guide to what is going to happen. If this were the case then favourites would always win. They don’t. …I don’t bet to provide a prediction tool for journalists who can’t be arsed. I bet to try to win money…Betting prices are NOT a good indicator of political outcomes…” – Mike Smithson, PoliticalBetting.com, 23 April 2015[0814e]
Academic work has focused on other forms of political betting such as prediction indices, but despite their general belief, academics such as Professors Laura Beers[0814g] and Leighton Vaughn Williams acknowledge that sometimes betting markets fail. Vaughan Williams said in his written evidence to the House of Lords Select Committee on Political Polling and Digital Media:
“…In summary, the overwhelming consensus of evidence prior to the 2015 UK General Election pointed to the success of political betting markets in predicting the outcome of elections. In contrast, the 2015 UK General Election, the 2016 EU referendum in the UK, the 2016 US presidential election and the 2017 UK election, all produced results that were a shock to the great majority of pollsters as well as to the betting markets. In each case, the longshot outcome (Conservative overall majority, Brexit, Trump, No overall majority) prevailed…” – Professor Leighton Vaughn Williams, 16 January 2018[0814f]
The verdict
Being the best predictor is not the same as being a good one. Gambling odds – whether private books, majorities betting, sportsbooks or betting exchanges – can and do fail, sometimes spectacularly. Betting odds are simply the consensus of the betting community, weighted by wealth and risk appetite. Bookmakers offer a quick way to formulate, track and update that consensus, but gamblers are not omniscient and, like every other human being, they make decisions based on their knowledge of the present and the past. And that is not sufficient for perfect prediction. As a report to the Market Research Society once said: “…any attempt to predict the future depends on it resembling the past”.[0423l] In changeable times, when the past and present are no longer a guide to the future, people will fail, and the odds will fail with them.
Our analysis and metrics would suggest that, on the whole – but not all the time – odds are good at predicting the winner of an election on a binary basis. But that is all.
Acknowledgements
The following people were kind enough to make themselves available for interviews for this article:
- Graham Sharpe, former William Hill media relations director
- Matthew Shaddick, head of politics betting at Ladbrokes Coral Group
- Professor Christopher Wlezien, the Hogg Professor of Government at the University of Texas
- Matthew Engel, columnist and political betting correspondent at The Racing Post
Professor Leighton Vaughan Williams kindly provided his written report to the House of Lords Select Committee, and links to his work in this area. He is the professor of economics and finance, director of the Betting Research Unit and director of the Political Forecasting Unit at Nottingham Business School.
Their contributions are gratefully acknowledged: any errors or omissions herein are solely mine.
Author’s notes and caveats
On books versus odds
Many of the calculations in this article use a book – the set of all odds on a given election offered by a bookie at a given moment – as the basic unit of gambling, not odds. Additionally, the odds will have the overround removed so that the total probability of the book adds up to one. Similar calculations on an individual odds with its overround intact may yield different results.
On the 1992 General Election
Coral insists[0814a] that they made the Conservatives the favourites for the 1992 General Election. This claim may be entirely true. But the British Newspaper Archive makes no mention of it, and contemporaneous newspaper reports state instead that Labour were favorites with the big bookmakers up to the last day,[0712z] then more money came in on election day[0712z][0712y] and the lead changed hands[0712z] before ending up as a dead heat.[0712z] So, although Coral’s claim may be true, without a contemporaneous timestamped source, we cannot use it.
About the author
Timothy Martyn Hill is a statistician who works in the private sector.
Disclaimer
To pass the compliance requirements of my employer, my affiliation for this article is “independent” and I state the following disclaimer: “The views expressed in this article are those of the author and in no way do they reflect the opinions of any entity or organisation with which the author is – or has in the past, or may in the future be – affiliated.”
Editor’s note
Timothy Martyn Hill’s investigation and analysis of the history of political betting and its predictive performance has been a mammoth undertaking. A multi-year passion project, if you will. The above is just the tip of the iceberg; an edited, condensed version of the work that the author has done.
For readers who share Hill’s fascination with the subject of political betting, we refer you to the following articles, also written by Hill (but unedited by us):


