Voting intention polls appear to have an accuracy problem. The UK House of Lords recently instructed the polling industry “to get its house in order”, citing its failure to predict the outcomes of the 2015 and 2017 general elections and the 2016 “Brexit” referendum. The Lords report stated that: “For each of those events, albeit to varying degrees, the polls ‘called it wrong’.” But is this recent poor performance a temporary blip? Or is it part of a longer term decline in accuracy?
These are just two of the questions we consider in this article, the latest in our “Forecast error” series. Previous articles in the series considered many predictors for just a single election, but this instalment examines an individual class of predictor across many elections. We begin with opinion polling, and we start by looking at how well opinion polls have performed as predictors.
(For the sake of fairness, we must acknowledge that the producers of political opinion polls state that polls should not be used as predictors – even though they often are.)
Global accuracy
First we will review the performance of polls globally, using data from a March 2018 paper by Jennings and Wlezien, titled “Election polling errors across time and space”.
The paper looked at 30,916 polls from 1942 to 2017, covering 351 elections in 45 countries. It examined annual mean absolute error (MAE) and log-odds ratios between 1942 and 2017; MAE per day from t-minus 200 days to t-minus zero; MAE for large parties in recent elections 2015–2017; and modelled MAE over the last week by election type (presidential/legislative), electoral system, effective number of parties, party size and incumbency. The paper selected the two largest parties for MAE post-facto which affected predictiveness, but the authors compensated by selecting the three largest parties when the pair with the highest votes wasn’t the pair with the highest poll share.
The paper found that on a global basis:
- There is no evidence that poll errors have increased over time, and the performance of polls in very recent elections is not exceptional.
- Larger parties have larger polling errors than smaller parties, and this is important when elections are close as it affects government formation.
- Errors are lower in systems that use proportional representation.
- Errors are also lower for presidential elections (at least in the United States and France) compared to legislative elections.

FIGURE 1 Copy of Figure 2b from “Election polling errors across time and space” (2018). For original, see doi:10.1038/s41562-018-0315-6. The mean absolute error across all parties/candidates and elections in a given year is indicated with a black circle.
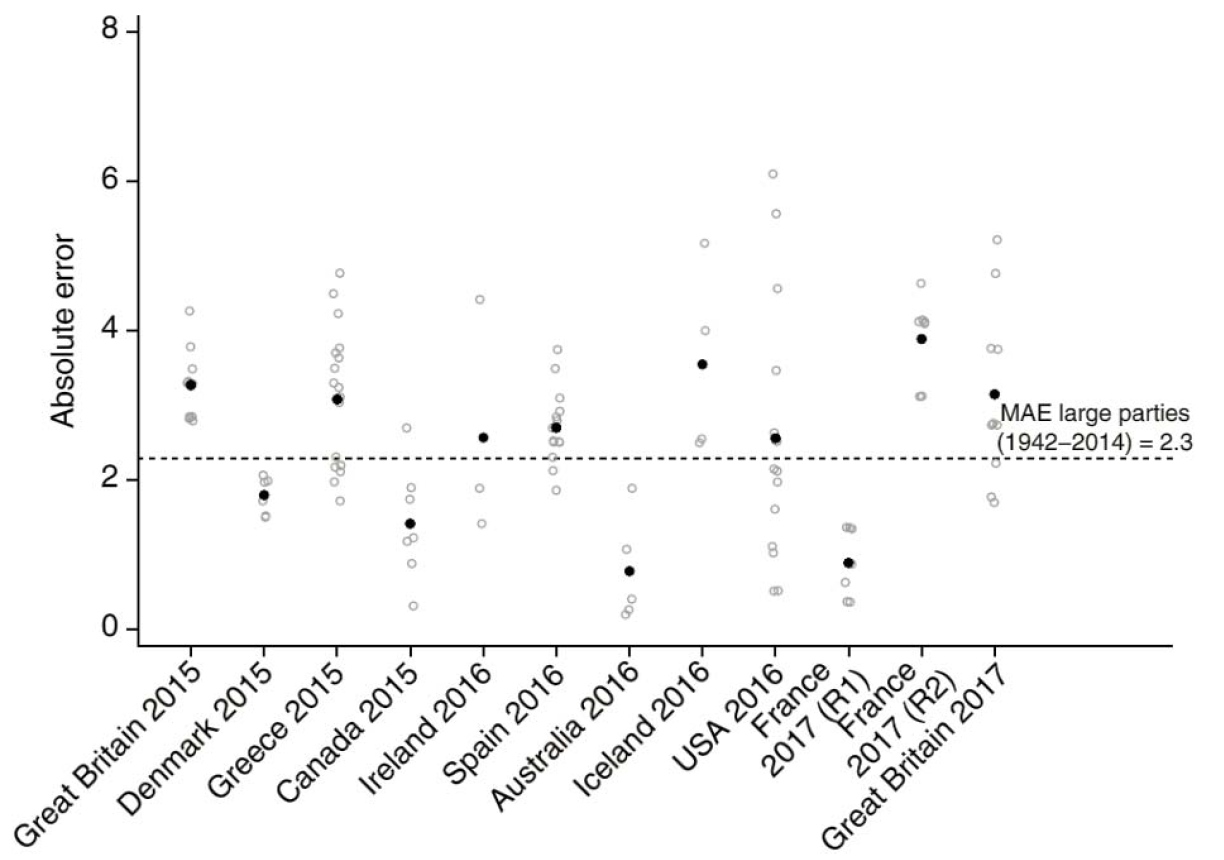
FIGURE 2 Copy of Figure 3 from “Election polling errors across time and space” (2018). For original, see doi:10.1038/s41562-018-0315-6. The dashed black line is the mean absolute error (MAE) for ‘large’ parties over the 1942–2014 period. The black circles indicate the mean absolute error across polls for each election. The grey unfilled circles indicate the absolute error of individual pollsters.
So, globally, polls are accurate and they aren’t getting any worse. But how are they doing in the UK?
UK accuracy
On 31 March 2016, the British Polling Council (BPC) and the Market Research Society (MRS) published the report of the inquiry into the 2015 British general election polls, led by the ESRC National Centre for Research Methods (NCRM). That inquiry contained a graph of the average MAE for the final election polls for each year from 1945 to 2015. We created our own version from 1945 to 2017 and joined the dots. The resultant graph is given below:
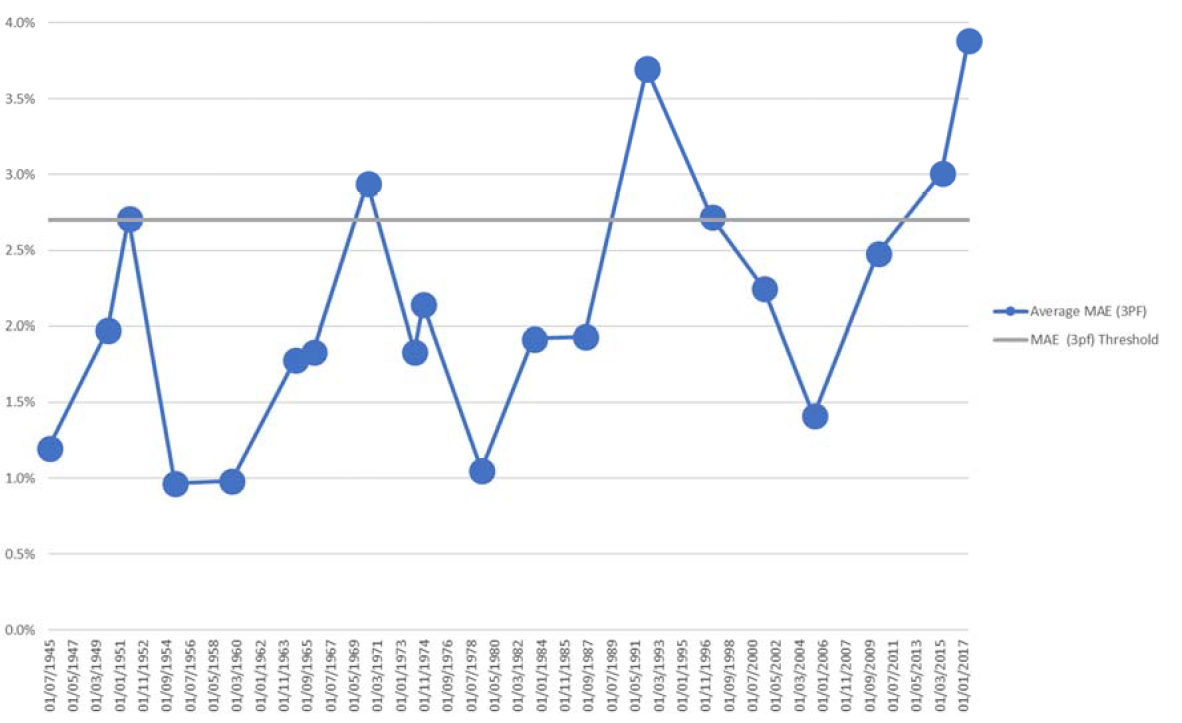
FIGURE 3 Average MAE per election for final polls on a Con/Lab/Other basis, 2.7% threshold. Final polls are taken from the 2015 NCRM report and the 2017 BPC release.
We repeated the exercise for the WIN indicator: if a poll correctly predicts the winner then it has a WIN of “1”, otherwise it is “0”. That graph looks like this:
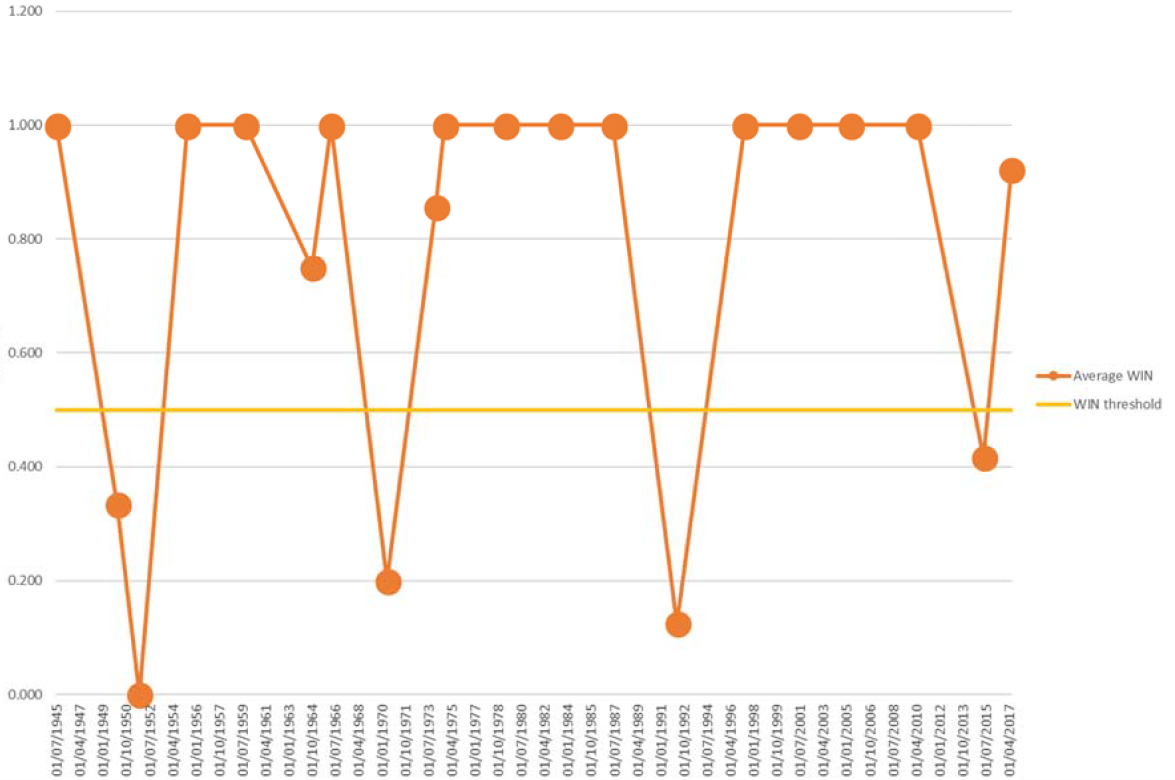
FIGURE 4 Average WIN per election for final polls, 0.5% threshold. Final polls are taken from the 2015 NCRM report and the 2017 BPC release.
The data appear cyclical, with the cycles being 1937-51, 1952-70, 1971-92 and 1993-2017. But is this a real phenomenon? To examine this, we looked at the history of political opinion polls in the UK. We found that periodically, since 1945, there have been UK polling failures: in 1951, 1970, 1992 and 2015. After each failure, the pollsters have generated new techniques or revised their assumptions about voting intention or turnout, etc. The MAE for succeeding elections are lower, but eventually begin to rise again until they become unacceptable, and the cycle begins anew.
Recent UK accuracy
We’ll next look in detail at polling performance in two recent elections; specifically, the general elections in 2015 and 2017.
The final polls for 2015 are listed in Table 1 below. Unpublished polls are unpredictive so the unpublished Survation poll of 8 May 2015 is not included here and the Survation poll published on 7 May 2015 is used instead. ICM released an early “interim” version of its final poll: we have ignored it in favour of its actual final poll. The non-BPC SurveyMonkey, BMG and Ashcroft polls are included for completeness.

Now let’s look at 2017. The non-BPC Norstat, Qriously and SurveyMonkey polls are included for completeness. The BPC omitted the ORB poll of 4 June 2017 from their analysis, but we have included it.
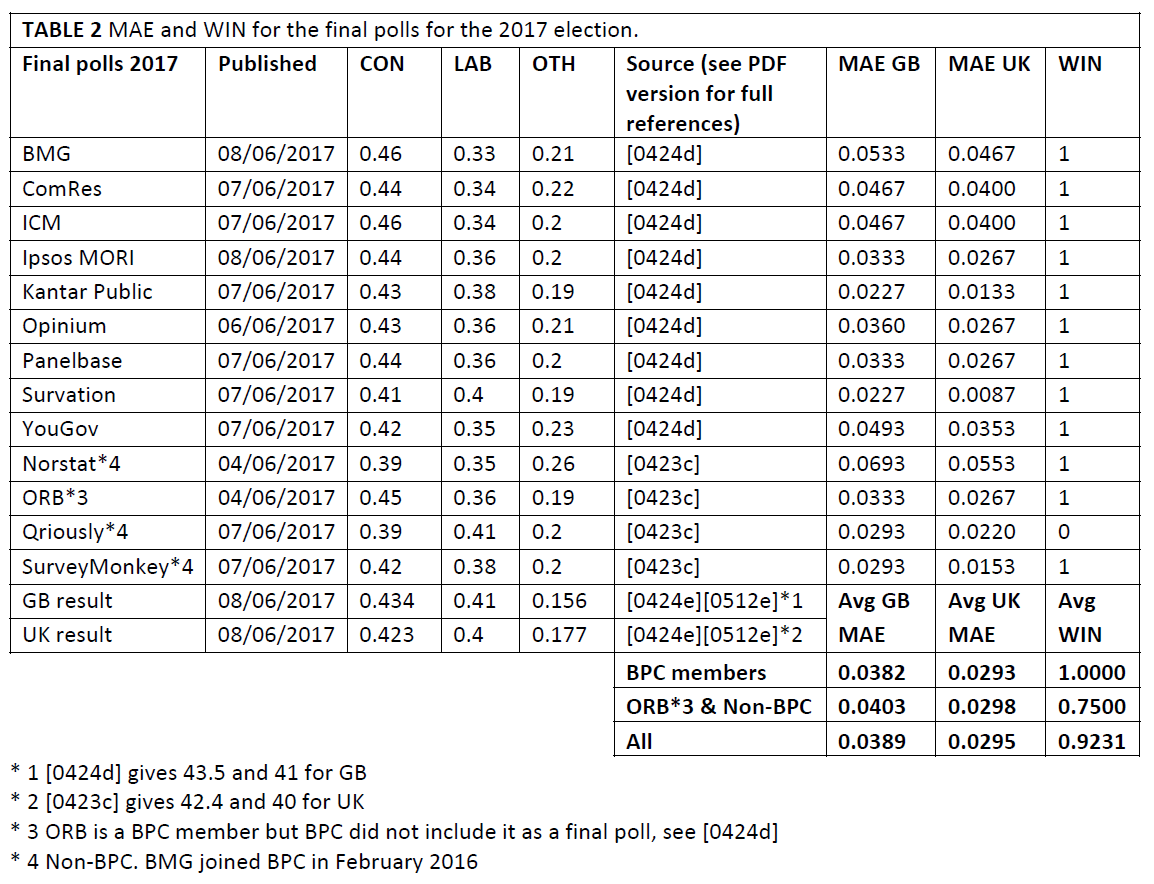
These are not good numbers, in either election. The MAE is over our 2.7% threshold in both cases (see PDF version of this article for full explanation of the threshold level). However, note the WIN indicator: in 2015 a majority of polls did not predict the winner, but in 2017 they did.
How were these polls received by the general public? Following the 2015 election, general opinion was that the polls had failed. This opinion was not restricted to academics and pollsters; it was shared by newspapers, other media, data scientists, the commentariat, election strategists and celebrities. Following the 2017 election, reactions were more diffuse, with YouGov and Survation being thought of as decent performers. But nobody thought the 2017 polls were a roaring success. By then, pressure had built up. Even before the 2015 election, regulation of polling had been proposed, and following 2017, it was proposed again. At that point the House of Lords had had enough and announced a committee to investigate. That committee reported on 17 April 2018, and while it declined to recommend regulation – and agreed with Jennings’ assessment that polls had not become more inaccurate over time – it nevertheless thought that, for various reasons, polls may have recently taken a turn for the worse and may continue to deteriorate.
Investigative tools
How might the polling industry respond to the Lords’ urging to “get its house in order”? Are there any investigative tools they can apply to improve predictiveness?
Firstly, let’s consider house or mode fixed effects. There is always the urge to believe in a “gold standard” – the fabled indicator that is better at predicting an election than the other indicators and does so consistently across elections. Unfortunately, there just isn’t one. Academics and pollsters insist that there is no such thing as a consistent fixed effect. Poll modes are dictated by economics as well as accuracy, and mode effects may simply not be consistent from election to election. Pollster rankings are not constant as old pollsters leave, new pollsters join, and new techniques are adopted. ICM were one of the best in 2010 and one of the worst in 2017.
So there’s no such thing as a consistent fixed effect. But how about an inconsistent fixed effect? This isn’t a hypothetical point; it really happens and here’s an example. During the 2016 Brexit referendum, it became apparent that a mode effect was present: the polls based on online panels said the race was close, but the polls based on telephone calling showed a consistent lead for the Remain camp. One of them was presumably wrong, but people could not agree on which one and some just plumped for half-way between the two. As it turned out, the polls based on online panels were closer to the truth, and if the polls based on telephone polling had been discarded, the overall predictiveness of the polls would have improved.
That example is particularly famous, but there are others. Indeed, a similar situation arose during the 2017 general election. As the campaign progressed it was hypothesised by Sturgis and Jennings (among others) that there was a mode effect: polls using turnout models had higher Conservative leads than those using self-reported turnout. Again, if those polls that used turnout models had been discarded, predictiveness would have improved.
This is all well and good, but can we do anything useful with such transitory fixed effects? Possibly, but it’s a risk. If a transitory fixed effect is found to exist, there is no obvious way of telling which mode is correct. Even worse, it might simply be an artefact: the more you look for a pattern, the more likely you are to find one, so this might be spurious instead of a real phenomenon. Jennings urges caution and notes that such things are only useful insofar as they inform the methodology.
(Another possibility is leader ratings. Some modellers use leader ratings instead of voter intention polls to predict election outcomes, so the question arises whether they can be used to predict a possible polling failure. This will be the subject of later work.)
Future development
Currently, the polling industry is evolving in a “big data” direction thanks to the increased availability of data sets and the tools to link them together. New techniques can be discovered via the internet, rapidly applied via easily downloadable software, and used with minimal delay and cost.
The increased use of online panel polling, the popularity of the open-source R language and the availability of open-source R-compatible modelling functions makes the increased use of models irresistible. One such technique is MRP (Multi-level Regression and Poststratification). This takes the results of an online panel, infers from them the voting behaviour of specific characteristics, such as age, gender and area type, and uses that to predict how each individual constituency will vote. This technique was applied to good effect by YouGov in the 2017 general election, though less well by Lord Ashcroft during the same period.
One problem with innovation is that it tends to come from outside politics. The driver for innovation comes from the interaction between polling agency and client, as the client will seek out new techniques that they believe to be good and the polling agency will generate and offer techniques in the hope of attracting clients. The problem is, political pollsters in the UK tend to be smaller subdivisions of larger market research organisations (MRO) such as YouGov or Kantar, or entities with specialised funding. Those organisations will focus on their higher-value clients and, in the UK, such high-value clients will be commercial organisations; the clients who want to discuss political opinion polls will be the media, academics and political parties, all of whom have less money to spend than commercial organisations.
Consequently, political pollsters in larger firms may be constrained by the techniques and concerns of the parent company, instead of generating innovations of their own. Since the commercial pollster and the political pollster may be the same people in different rooms, this is not necessarily a problem (and there is a tendency for MROs to use political polling as a loss-leader or “shop window”), but a smaller or hungrier firm may be more flexible. A recent example of such flexibility is Matt Singh’s use of river sampling, where respondents are invited to take part in surveys via online ads and other offers.
A further ongoing development is the move towards expressing polls as ranges instead of single data points. On 1 May 2018, the BPC announced that it now requires its members to include this statement in its polls: “…All polls are subject to a wide range of potential sources of error. On the basis of the historical record of the polls at recent general elections, there is a 9 in 10 chance that the true value of a party’s support lies within 4 points of the estimates provided by this poll, and a 2-in-3 chance that they lie within 2 points…” This sentence was derived from a study of the final polls for each general election since 2001 and is a practical solution to the problem of calculating confidence intervals for nonprobability sampling.
The UK has been lagging behind the US in addressing this problem, as indicated by this statement from a US poll in November 2016: “…Because the sample is based on those who initially self-selected for participation rather than a probability sample, no estimates of sampling error can be calculated. All surveys may be subject to multiple sources of error, including, but not limited to sampling error, coverage error, and measurement error… ”. So this change is a welcome uplift of UK polling to US standards, although it is not as sophisticated in that regard.
Conclusions
When the Lords discussed the performance of the polls, they were much taken with recentism. They acknowledged Jennings’ thesis that polls were not getting worse globally, but were still convinced that things had gone wrong recently and that things might get worse. As Sturgis points out, they may be correct: polls are currently not good and there is no a priori reason why they should get better.
That said, we have been here before – several times. The current situation of inaccurate polls, soul-searching by the industry, calls for regulation and so on is not unique and has happened on a number of occasions since 1945. There are a posteriori reasons for supposing polls will get better because UK poll accuracy appears to be cyclical.
Polling is subject to periodic failures, and those failures are followed by experiment, the development of new techniques and the updating of assumptions. Those adjustments cause the errors to decrease and the problem is thought to be solved. And due to human inertia that is true, at least for a while. But invariably assumptions will eventually date, the errors will creep back up and the cycle begins again. The cycle length is around 20 years from peak to peak and trough to trough.
We are currently in another trough. We may not escape it, but history suggests it is possible to do so – and the signs of adjustment are present: the industry is experimenting, generating techniques and questioning assumptions, and hopefully this will lead to another upswing in accuracy.
Acknowledgements
The following people were kind enough to make themselves available for interviews for this article.
- Professor Will Jennings
- Professor Stephen Fisher
- Professor Patrick Sturgis
- Luke Taylor of Kantar
- Anthony Wells of YouGov
Their insights were highly detailed and could have filled a much larger article, so the author was forced to use only a small selection. Their contributions are gratefully acknowledged: any errors or omissions herein are solely the author’s.
About the author
Timothy Martyn Hill is a statistician who used to work for the Office for National Statistics and now works in the private sector.
A longer and fully referenced version of this article, with appendices, is also available.


