
An election to the office of President of the United States happens every four years on the first Tuesday after the first Monday in November. The next presidential election will take place on 3 November 2020. It is held in extraordinary circumstances, as an incumbent fights for re-election in the middle of a global pandemic.
There are two possible outcomes. Either Donald J. Trump surprises the pollsters and retains the presidency (in which case, there will be articles to be written about a legendary polling failure). Or the challenger Joseph R. Biden wins, and the pollsters will feel vindicated.
But pollsters aren’t the only ones opining on the possible outcome of this year’s vote.
Academics and modellers
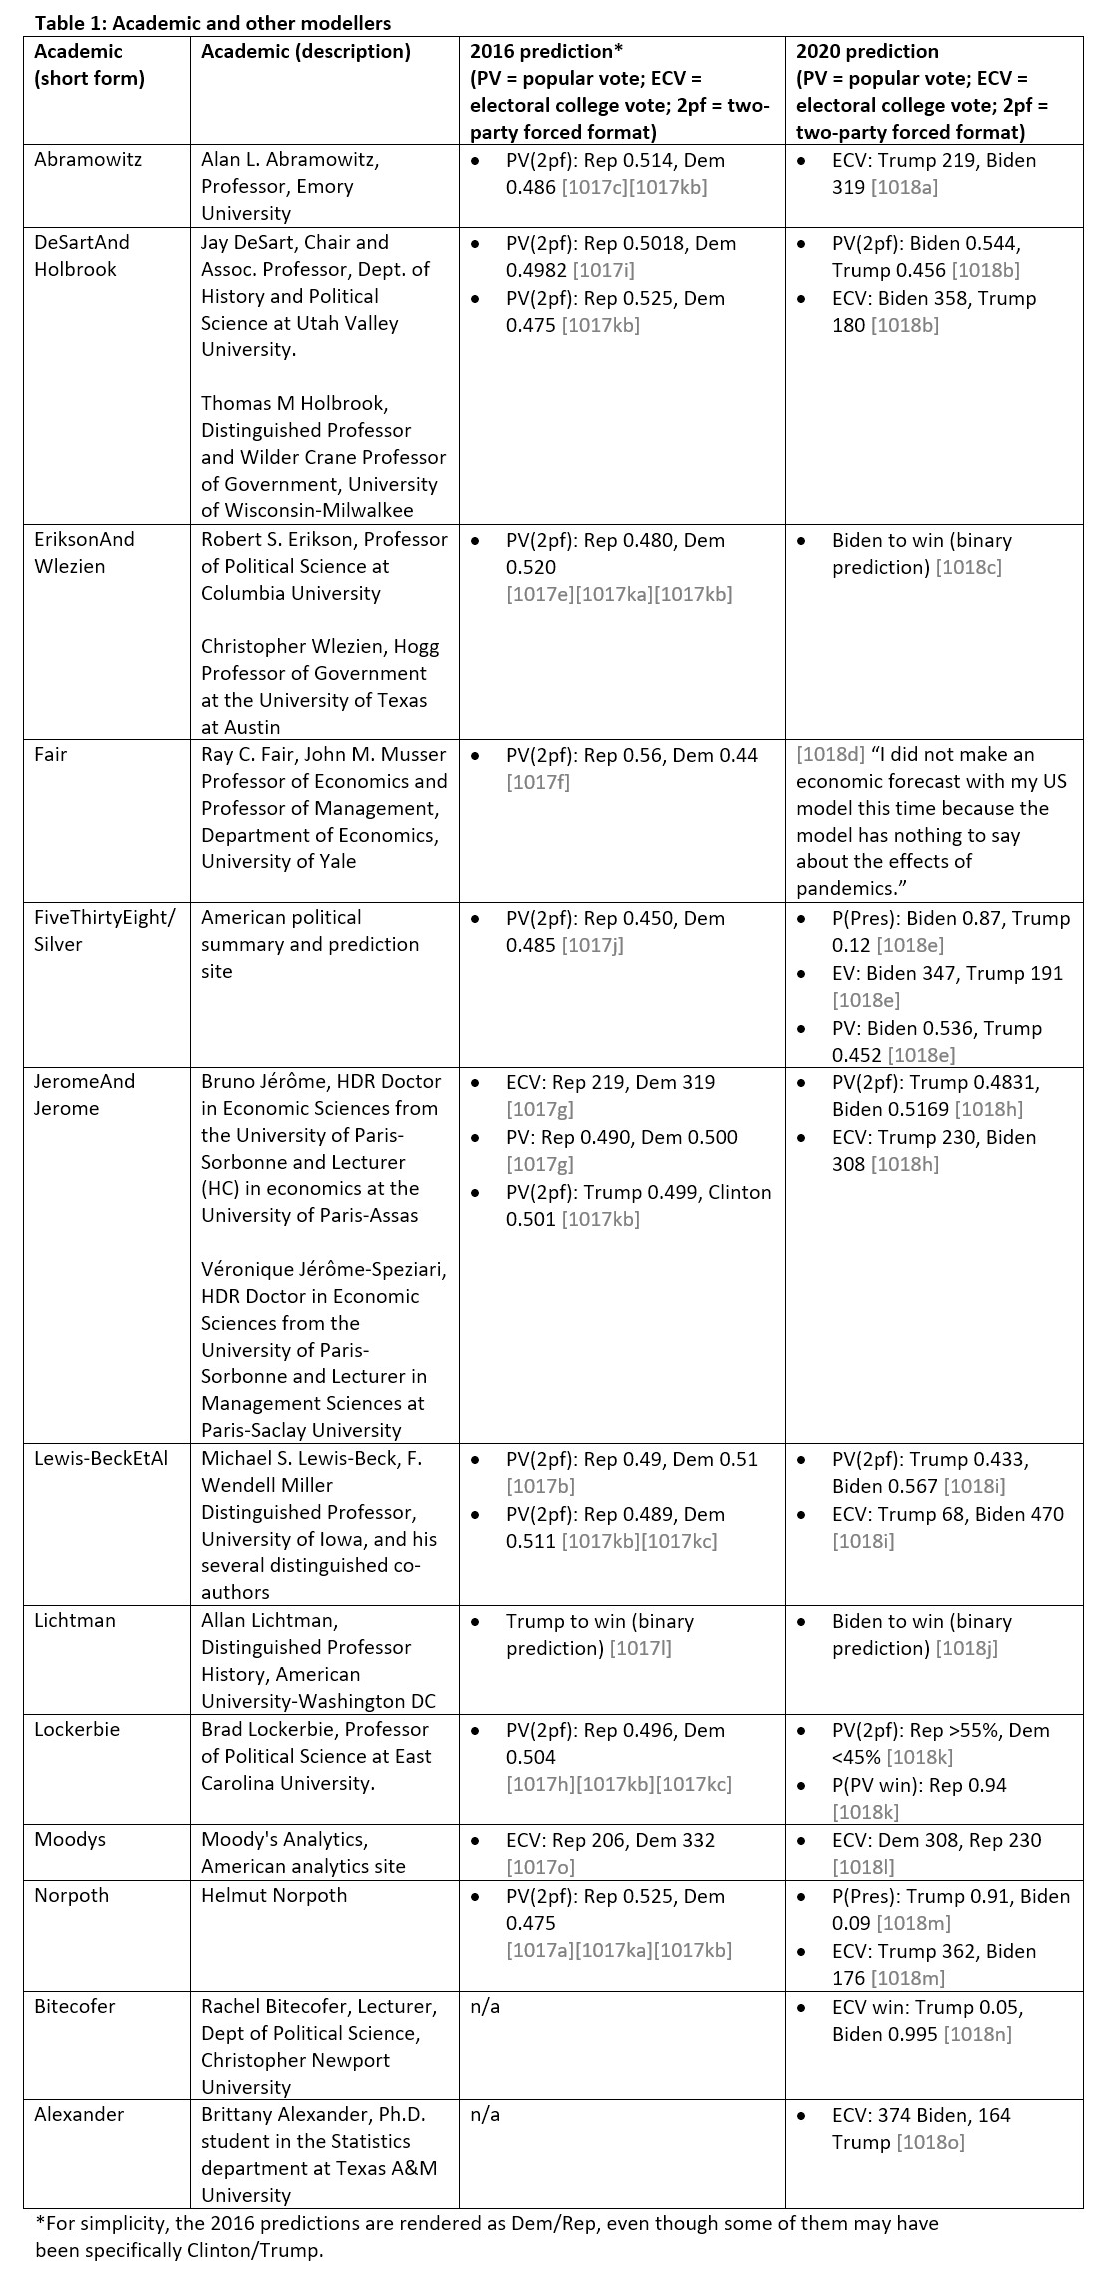
Every presidential election is accompanied by a coterie of academics and other modellers, who over the years have built a cottage industry of predictors that appear in academic journals, or occasionally the news. This election is no different, but the predictions this time around are more strained. Some refuse to predict: Ray Fair sensibly declined, saying that: “I did not make an economic forecast with my US model this time because the model has nothing to say about the effects of pandemics.” The poll-based modellers are predicting various flavours of a Biden victory, but the economics-based modellers are predicting a Biden landslide not seen since Reagan. The non-economic modellers, meanwhile, are not so consistent and I wish to mention two in particular: Helmut Norpoth and Allan Lichtman. These two use somewhat unusual methods to predict the outcome – Norpoth uses votes in the primaries, Lichtman a set of binary indicators – and they provide a counterpoint to the other, more conventional, modellers. In this election they disagree: Norpoth says Trump will win, Lichtman says Trump will lose.
The academics and other modellers who have made predictions for 2020 are below:
Odds
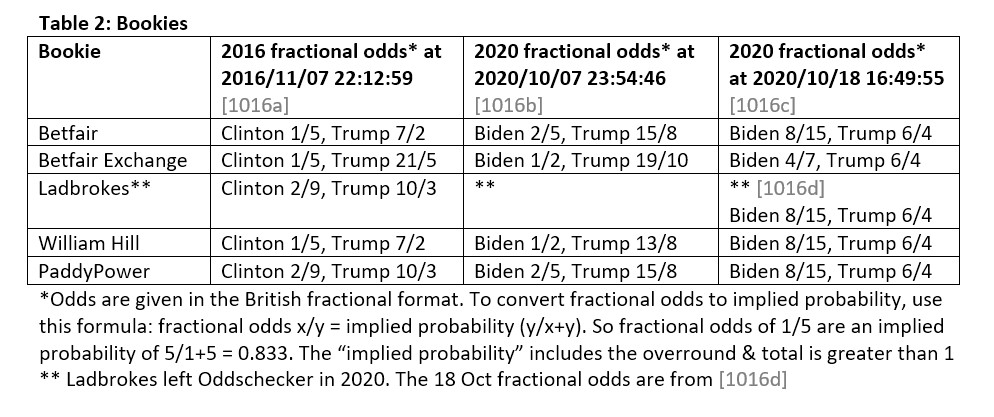
Political betting in the United States is usually considered to be illegal (a full discussion of this is outside the scope of this article) although there are analogous concepts such as prediction markets. Thankfully, political betting is entirely legal in the United Kingdom, and British betting has gained a reputation over the years as a tolerated milieu for betting on US elections. There are several bookies, but to enable comparisons to 2016 we will choose Betfair, Betfair Exchange, Ladbrokes, William Hill and PaddyPower. Those nationwide odds for 2020 are:
Prediction markets
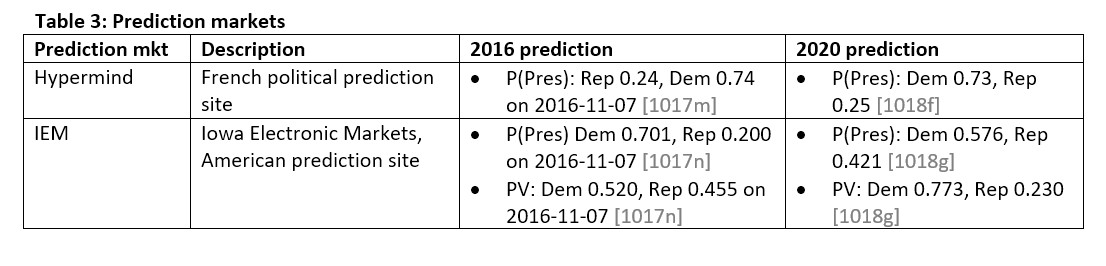
Prediction markets are a rather odd concept that utilize the power of gambling to converge on a predictive solution without actually legally being defined as gambling. They do this by devices such as limiting the number of participants, capping winnings, or issuing them in a nominal form such as gift tokens, and thus are somewhat disparagingly referred to as “toy markets”. The two presented here are Hypermind and Iowa Electronic Markets (IEW). Those prediction markets for 2020 are below:
Nationwide opinion polls
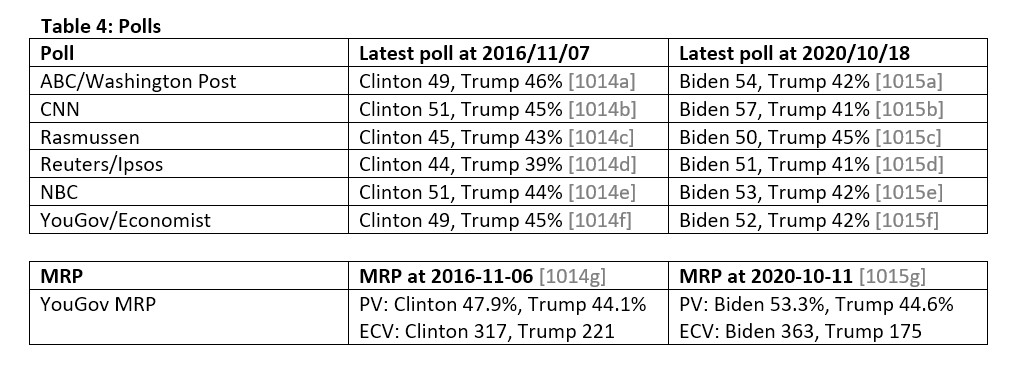
The nationwide opinion polls cover the entire US. There are several polls, but to enable comparisons to 2016 we will choose ABC, CNN, Rasmussen, Reuters and NBC. We will also include YouGov, who ran a MRP prediction in 2016 and 2020. MRP is multilevel regression and poststratification, a method used to predict electoral college votes from opinion polls. Those nationwide opinion polls for 2020 are:
Statewide opinion polls
Statewide polls focus on specific states. Well-resourced analysts may spend a considerable period of time investigating these polls, on the basis that by doing so they can predict the electoral college votes and thus the presidency. However, statewide polls are less frequent than their nationwide equivalents and they are asynchronous: the states are not polled at the same times nor frequencies. As we do not have the resources to process the data, we will discard statewide polls from consideration. Because of this we will limit ourselves to predicting the popular vote, as we will not be able to use the state data to predict the Electoral College.
Are the polls reliable?
Opinion polling gained a poor reputation in the 2010s following a series of high-profile failures to predict the winner. So, we have to consider the possibility that the polls are similarly inaccurate here. How shall we do this? Certain rules-of-thumb, not robustly underpinned by theory but facially plausible have been used to indicate whether a polling failure is in progress, and we detail them below.
Three-party forced MAE
In previous work on British elections, we noted that the mean absolute error (MAE) for opinion polls on a three-party-forced basis (Lab/Con/Oth) showed cyclicality and coincided with polling failures. We hypothesized that consideration of the graph could indicate where we are in the cycle and hence whether a polling failure is due. So, do the US polls also show such cyclicality when plotted on a Dem/Rep/Oth basis? The graph is below.
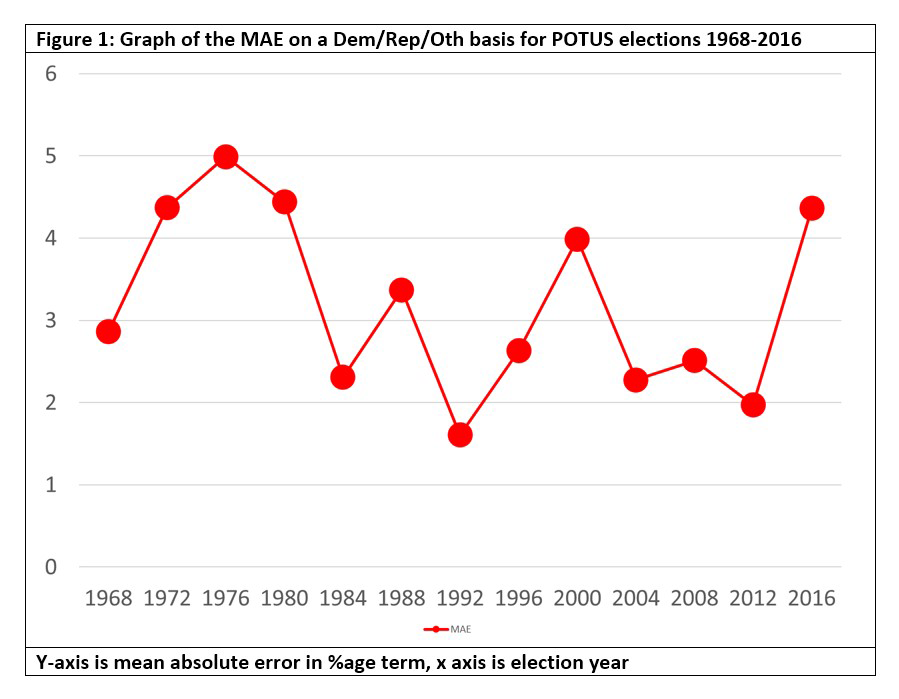
The first thing that springs to mind to British eyes is that these are big errors: including three-, four- and five-way polls in the average raises the MAE. Polls for UK General Elections have smaller MAEs on a Lab/Con/Oth basis and MAEs over 2.7% are considered polling failures in the UK. But British elections are multiparty, and despite frequent efforts by US third-party candidates to break through, US politics is still two-party dominant and US elections are more robust to polling error. So, this is not a problem. There is an element of cyclicality, though more up-down-up-down than the UK’s ebb and flow. In 2016, there was a peak. Are we due a trough?
Following the 2016 election, the American Association for Public Opinion Research (AAPOR) issued a document called “An Evaluation of 2016 Election Polls in the U.S.”, better known as the “Kennedy report” [1008a][1008b]. It found that although national polls were generally correct and accurate by historical standards, the state-level polls clearly under-estimated Trump’s support in the Upper Midwest states. It listed various reasons for this underperformance (including shy voters, nonresponse bias, and the perennial favourite, “late swing”), but the one we discuss here is weighting.
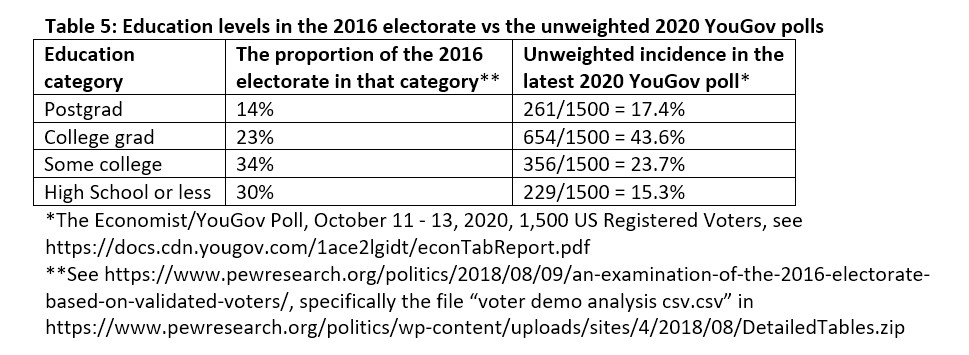
Weighting is the method by which pollsters bring their sample characteristics into line with the population: if the sample has too many men and not enough women, say, then the female response is weighted upwards and the male response weighted down. In 2016, the pollsters were getting too many postgrads, not enough blue-collar workers, and didn’t weight for that.
Have they fixed it? American pollsters give some details about weighting, but not necessarily in enough depth to deduce the weights by education. FiveThirtyEight [1008d] and others [1008c] say that some have fixed the problem and some haven’t. A more subtle problem is one that is little discussed: weighting can only compensate for an unbalanced sample, but it can’t cure the underlying problem totally. In the 2015 UK General Election, for example, YouGov made a sustained attempt to make its panel more representative and saw its effort rewarded in its polls for the 2017 UK General Election. But an inspection of the YouGov USA 2020 poll yields the table below: plainly YouGov still has a problem getting responses from blue-collar voters. Will its use of weights to compensate for this be enough?
In 2016 the US pollsters recognized that their process was problematic, genuinely investigated, diligently reported and recommended changes. But it’s a civilized response to a perceived minor error. They have not yet undergone the more Darwinian harrowing of UK pollsters, who had to cope with two elections in rapid succession that winnowed out the inadequate fixes and the inadequate pollsters with them. The US response is good. It might work. But it might not be enough.
Mode effect
Famously the 2016 EU referendum was accompanied by a noted mode effect: those polls that used telephone canvassing showed notably different results to those that used online panels. A report was commissioned to try to analyse that phenomenon, but the assorted notables did not reach a convincing consensus. In the event, the online panel polls proved correct and telephone polls eventually fell out of favour in the UK. So, the existence of a pronounced mode effect may prefigure a polling failure. Does such an effect exist in 2020?
The FiveThirtyEight Github folder of polls [1013a] contains a file of presidential poll numbers [1013b]. We took that file and grouped the polls into three super categories: “online”, “phone”, and “other/mixed”. For a description of these categories please see the appendix.
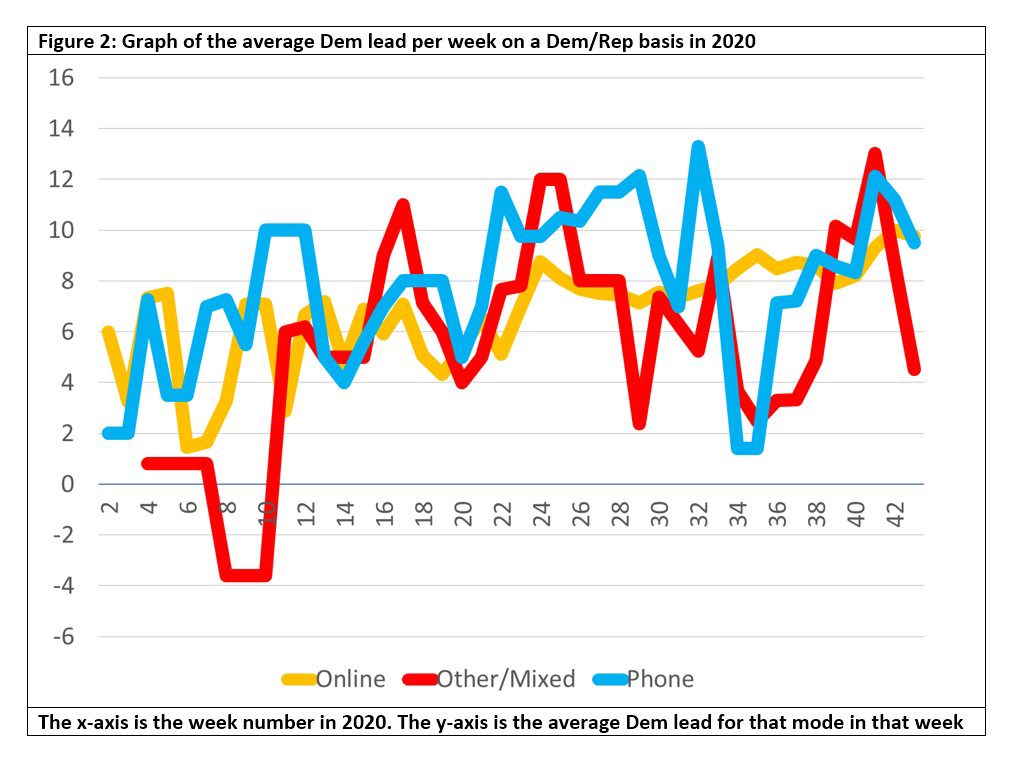
Unlike the EU referendum, any mode effect here seems subtle and has to do with the volatility. People who take part in online-only polls went Biden and stayed Biden, with an average Dem lead per week of over 8% for the past four to five months. The phone polls were much more volatile, recording very low Dem leads (though still positive). The mixed/other polls were similar to the phone-only polls.
How do we interpret these data? If we assume that online-only people are more Dem, then that would fit: they went Biden early and stayed Biden regardless. The phone-poll people were far more unsure and gyrated up and down.
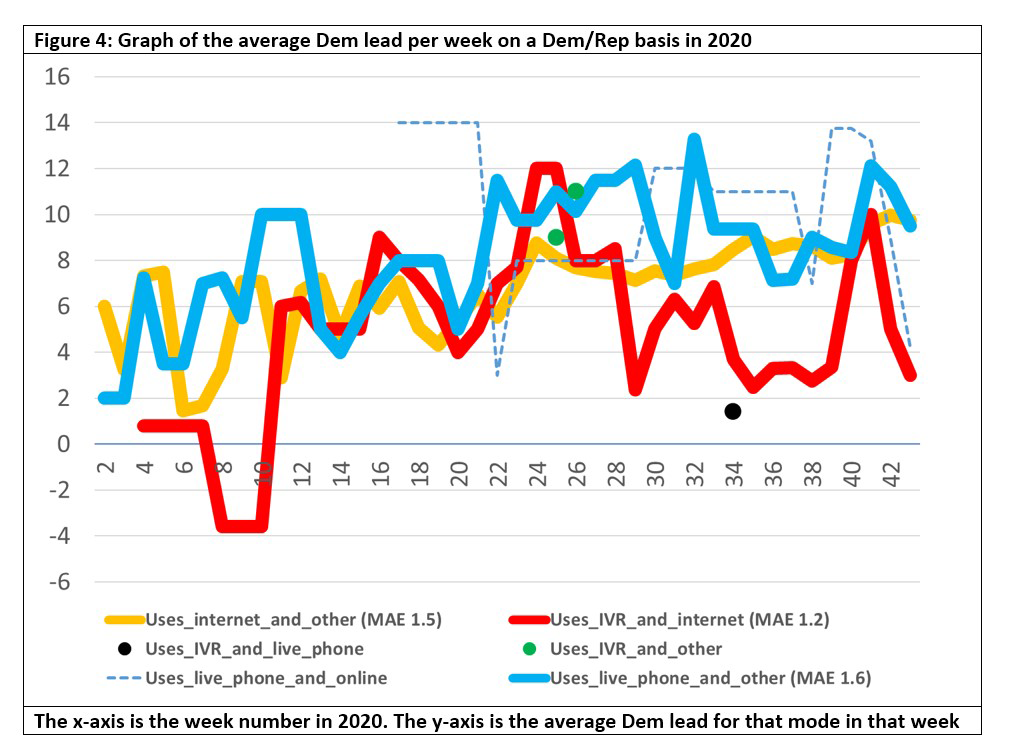
But this analysis is based on the British experience. On closer inspection we see that the US has several polling modes, [1011a] including live, online, IVR (interactive voice response, otherwise known as automated polls or “robopolls” or “robocalls”), and text. Britain doesn’t use robocalls so we need to separate them out. To do that we group the polls into a new set of super categories: “Online”, “Uses_both”, “Uses_IVR”, “Uses_Live_Phone”, and others. The graph is below. For a description of these categories please see the appendix.
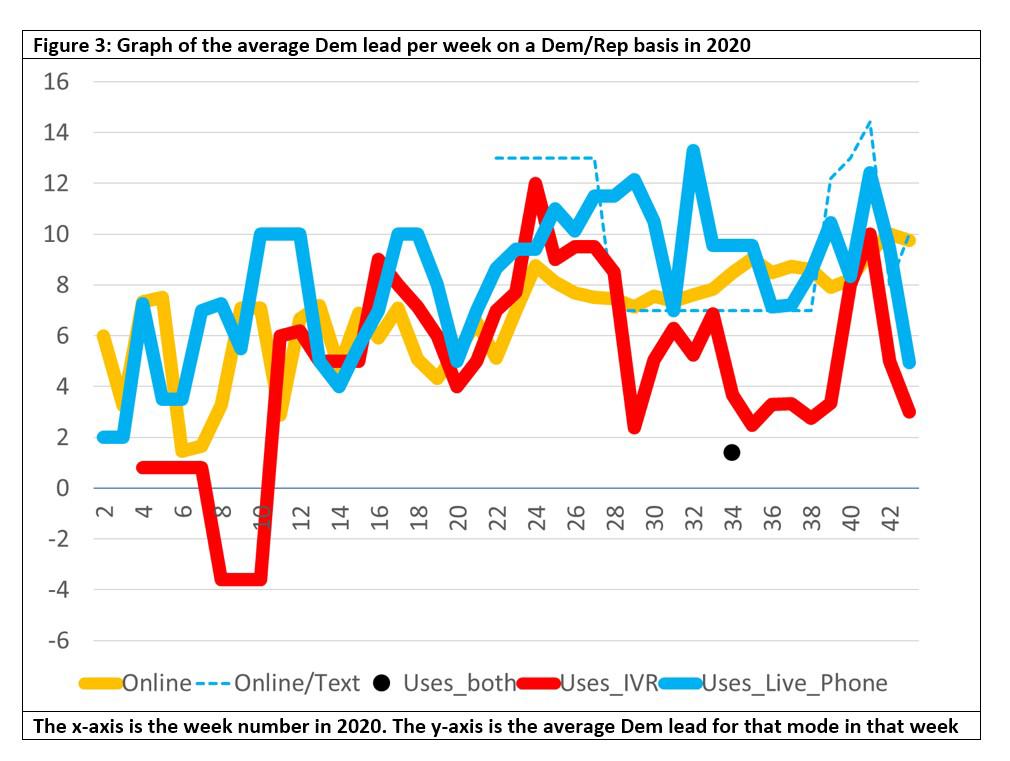
The black dot towards the end is the single poll from “EKOS Research Associates” on 2020-08-16, which had the unusual mode “IVR/Live Phone” and a Biden lead of <2%. This article will set aside that poll due to lack of data.
The picture is now clearer. Live phone polls have a higher Biden lead than IVR polls, which are lower. Online polls are still in the middle, though online/text polls are higher for Biden.
This seems promising: can we augment this somehow? Thankfully we can. The Kennedy report gives the MAE for certain super categories, and if we create another set of super categories and cross-reference Kennedy to FiveThirtyEight, then we can match the 2016 MAEs to those 2020 super categories. The new graph looks like this:
It can be seen that for those categories to which we can match a 2016 MAE, they are above the zero line, even taking that MAE into account. We do not know the MAE for the categories we cannot match, but if we assume their MAE is similar then they are also above the zero line with that assumed MAE. So even if the polls are as wrong in 2020 as they were in 2016, Biden should still win the popular vote if the polls remain at their current level.
The problem with probabilistic predictions
What is a “prediction”? Over the years we have seen the growth of a prediction variant called a “probabilistic prediction”, such as “The sun has a 99% chance of coming up tomorrow”. This use of probabilistic predictions is regarded as satisfactory by many modellers and they use a method called “calibration” to measure the accuracy: if the 99% predictions are right 99% of the time then the prediction is well-calibrated. [1004a] The public do not necessarily share this satisfaction, and some regarded the 2016 model-based predictions as wrong because the modelled probability of a Trump win was lower than Clinton’s. [1004b][1004c]
Unlike the public, the author genuinely agrees with the modellers that a well-calibrated probabilistic prediction is not wrong. But the author has a more subtle objection, namely that a probabilistic prediction is not actually a prediction. A prediction should be a statement that an event will happen on/after a named date, and a probabilistic prediction is not a prediction but a description of the solution space. Are we in a position to make such a prediction?
To that end, let us consider the case for both parties.
The case for Joe Biden winning the popular vote
At the time of writing, Biden has a lead in the opinion polls and has held it consistently for some time. The polls have been corrected for education levels and even if the polls are as wrong now as they were in 2016, he will still win the popular vote. Early returns of postal or in-person votes are running 54.9% registered Democrats, 24.3% registered Republicans, [1012a] and a poll of voters indicates that a majority of those who vote early will vote for Biden [1012b]. All the polls and a majority of the modellers say that he will win the popular vote, and all the betting odds and prediction markets say that he will win the Presidency. It is entirely plausible that Biden will win the popular vote.
The case for Donald Trump winning the popular vote
Trump is the sitting president and sitting presidents usually win a second term. Most of the people who propose to vote on election day itself intend to vote Republican [1012b] and it is entirely plausible that early votes closer to the election will swing Republican [1012d]. The fundamental problems with the polls – social satisficing, differential non-response, unrepresentative sampling, poor response rates, voters omitted from the sample frame – have been compensated for, not fixed. Some modellers think Trump will win and although he is behind in the betting odds, he holds a majority in the actual number of bets placed [1012c], and that metric predicted Britain’s EU Referendum outcome. Trump’s September job approval rating at 46% [1012e] is larger than the one-term Presidents George H. W. Bush and Jimmy Carter at the same point in their cycle. There is an obvious precedent for Trump: George W. Bush lost the popular vote in 2000 but won it in 2004. It is entirely plausible that Trump will win the popular vote.
Conclusion
If the polls remain where they are on 22 October 2020 then Biden will win the popular vote on 3 November. But the polls are volatile and at the time of writing Trump has started to eat into his opponent’s lead: it is not impossible that he may still win.
About the author
Timothy Martyn Hill is a statistician who works in the private sector.
Disclaimer
To pass the compliance requirements of my employer, my affiliation for this article is “independent” and I state the following disclaimer: “The views expressed in this article are those of the author and in no way do they reflect the opinions of any entity or organisation with which the author is – or has in the past, or may in the future be – affiliated.”


