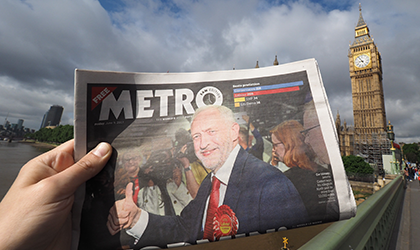
On 18 April 2017 British Prime Minister Theresa May announced a snap general election for 8 June 2017, hoping the country would deliver her the strong parliamentary majority she believed she needed to successfully conduct the UK’s Brexit negotiations. The result on 9 June – a hung parliament, with no party having an overall majority – was not what many of the pollsters, betting firms, modellers and academics were anticipating.
In this respect, it was one of the most interesting elections in a long while.
In this article, we will list the predictors of this election and how they performed between the announcement and election day.
Methodology
In reviewing previous elections, we outlined various problems and methods of coping with them. But this election was called at short notice and so there were other problems to contend with.
One obvious problem was that, due to the short notice, there weren’t that many academic predictors in the beginning – plenty of odds and polls, but building models takes time and academics and analysts needed a few days to catch up. To cope with this backloading, we tried to select predictors that extended from just after the date the election was called to election day itself, and preferably changed over time, to a maximum of five for each category.
The short notice also required a change in technique: instead of painstakingly trying to reconstruct every prediction, we took samples every Wednesday from Wednesday 26 April 2017, using the latest value at that point. This made data-gathering much easier and the flood of predictors on the last day could then be handled separately.
To comparably assess accuracy we will use four-party-forced: all predictions will be forced into of four categories corresponding to three parties – Conservative (Con), Labour (Lab) and Liberal Democrats (Lib) – plus all others (Other). These four-party-forced predictions are then measured against the result. This matches what was done in 2010 and 2015, and was computationally easier and enabled us to compare bets to odds to models.
As is our practice, we selected mean absolute error (MAE) to measure accuracy. It or its variants are widely understood by pollsters and modellers, and can be used for any finite prediction that can be handled arithmetically. But there are problems with using MAE: it has no direction and doesn’t differentiate between an underestimate and an overestimate. To get around these problems, we will also note whether the predictor actually predicted the winner (WIN). For a four-party-forced prediction, the definitions of MAE and WIN are given below.
- MAE = Mean Absolute Error = [|prediction A – result A| + |pred B – result B| + |pred C – result C| + |pred D – result D|]/4
- WIN = Did it predict the winner? = “1” if it did, “0” if it didn’t
An example MAE calculation for a four-party-forced prediction of the 2015 election is given below.
TABLE 1 Example calculation for mean absolute error.
| Party |
Prediction | 2015 GB result | Absolute error | ||
| % | Prop’n | % | Prop’n | ||
| Con | 40 | 0.4 | 37.8 | 0.378 | 0.022 |
| Lab | 30 | 0.3 | 31.2 | 0.312 | 0.012 |
| Lib | 20 | 0.2 | 8.1 | 0.081 | 0.119 |
| Other | 10 | 0.1 | 22.9 | 0.229 | 0.129 |
| Total absolute error | 0.022 + 0.012 + 0.119 + 0.129 = 0.282 | ||||
| Mean absolute error | 0.282 / 4 = 0.0705 | ||||
The campaign
The campaign started when the election was announced on 18 April and ended when the polls closed at 10pm on 8 June. It was not a homogenous process and can be divided into distinct acts: Joe Twyman of YouGov went for three acts, but this article will subdivide his first and third acts into two parts each. And the story goes like this…
18 April to 27 April: Conservative ascendancy – This period was marked by a rapid increase in the Conservative party’s poll rating from the high 30s/low 40s to the high 40s, occasionally hitting 49% or 50%. Labour remained moribund in the mid to high 20s, and the talk was of a landslide, discussing not just whether Labour would be beaten but whether there would be anything left of the party afterwards. Parliament prorogued on 27 April.
27 April to 15 April: Labour entrenchment – On 27 April Labour’s poll ratings crept up to 30%. They weren’t getting much better but they weren’t falling back either, and during this period neither party was budging much: Labour stayed in the high 20s/low 30s, the Conservatives stayed in the mid/high 40s. Labour was still losing but no longer dying in place.
16 May to 22 May: Manifestos are released – Between 16 May and 22 May, Labour and the Conservatives both launched their manifestos. Some of Labour’s policies were popular, but a Conservative manifesto commitment to change funding for elderly social care proved profoundly unpopular. It proposed paying for long-term care by using the proceeds of the estate after death and was instantly characterised by its opponents as the “dementia tax”. The commitment was rapidly disavowed on 22 May but the damage had been done: Labour had begun to creep up to the mid-30s and Conservatives down to the low 40s
22 May to 2 June: A terrible distraction – On 22 May 2017 a suicide bomber detonated a bomb outside an Ariana Grande concert in Manchester Arena, killing himself and 22 adults and children. This generated a brief pulse in the Conservative lead lasting two-to-three days. But as the effects dissipated, the polls began to pick up a rise in Labour: 38%, 36%, 37%, settling in the mid-to-high 30s. The Conservatives were still in the mid-to-low 40s but the days of discussing landslide victories were long gone.
On 31 May a leader’s debate was held on the BBC, gathering party leaders from the major GB parties (the NI parties did not attend). Corbyn and May had separately decided not to attend but, at the last minute, Corbyn decided to turn up and the debate took place, with the Prime Minister conspicuous by her absence. Two days later, Labour hit 40% in the polls.
3 June to 8 June: Another outrage – On 3 June 2017 three men went on a rampage in London, driving into pedestrians on London Bridge and stabbing random passers-by, killing eight people and injuring 48. They were shot dead. Again there was a brief pulse in the Conservative lead lasting two-to-three days, but when it had ended the polls simply hadn’t moved much: Labour in the mid-to-high 30s, Conservatives in the mid-to-low 40s, with Labour briefly in the lead in one poll but not by much.
The results
To measure accuracy of predictors against the results we have to define what the results are. We will use the figures from the British Polling Council’s (BPC) initial response as the GB vote share results, and the figures from the House of Commons Library Commons Briefing Paper CBP-7979 as the UK and GB seat results. We use GB vote share because despite making an effort to poll UK-wide for the EU referendum, pollsters yet again mostly polled GB-only for the 2017 General Election. We use UK seat results because no Labour, Conservative nor Liberal Democrat were elected to seats in Northern Ireland, so we can switch from UK to GB by just subtracting 18 from the “Other” category. The situation is further complicated by the Speaker (currently the Conservative John Bercow), who is counted as “Other” by some sources and Conservative by others. This article will adhere to the convention that the Speaker is “Other” which drops the number of Conservative seats by 1 to 317. This gives us the following:
TABLE 2 Results used by this article as the results of the 2017 General Election.
| Category | Con | Lab | Lib | Other | Total | |
| GB vote share (%) | 43.5 | 41.0 | 7.6 | 7.9 | 100.0 | Source |
| UK seats | 317 | 262 | 12 | 60 | 651 | Source |
Having established the methodology and results, we will now examine how each category of predictor performed.
The pollsters
Pollsters are people who do opinion polling in the UK. They range in size from wealthy individuals commissioning polls to multinational companies for whom political opinion polling is a loss-leader attracting clients to their main operations. Just before the Prime Minister’s announcement, the individual pollsters were focussing on polling and the changes required since the 2015 polling debacle. Martin Boon of ICM had just published a thought piece on emotional measurement. Joe Twyman of YouGov was advertising a course at Essex Summer School on “Achieving Impact through Quantitative Social Science”. His colleague Anthony Wells had just posted an item on his blog about that day’s YouGov poll. Ben Page of Ipsos Mori was spending Easter in Palermo, and his colleague Bobby Duffy had polled on society the previous week.
Whereas in previous years a poll took days to set up and complete, nowadays pollsters poll frequently on a wide variety of matters and can organise a new one very quickly. They adjusted to the announcement rapidly and, before the day was out, Bobby Duffy had published an item in the Independent, Anthony Wells had put up another blog entry, and ICM had released a flash poll.
In total, 14 pollsters polled on the 2017 General Election. We selected the five most frequent – Panelbase, Opinium, Survation, ICM, and YouGov – and tracked them through the campaign. Their MAE and WIN over time looked like this:

FIGURE 1 MAE for vote share polls between Wednesday 26 April 2017 and Wednesday 7 June 2017.
TABLE 3 Total WIN for vote share polls between Wednesday 26 April 2017 and Wednesday 7 June 2017.
| Date | 27 April | 3 May | 10 May | 17 May | 24 May | 31 May | 7 June |
| # correctly predicting Con win | 5/5 | 5/5 | 5/5 | 5/5 | 5/5 | 5/5 | 5/5 |
This was not a good performance by the pollsters and in different circumstances, such as the 2015 election, they would have been considered a failure. But the short notice, the fact that they predicted the winner correctly and got the parties broadly right (except for Labour) muted criticism. This phenomenon of forgiving poor predictors if they correctly predict the winner has been noted before by us with the 2014 Scotland Referendum and it will be seen again in this article.
The bookmakers
Betting on political events has become more popular in the UK in recent years, and a wide variety of bookmakers now offer bets, whether fixed-odds or spreads. They range from longstanding High Street bookmakers to online operations based in Gibraltar. The best-known website is probably the summary website Oddschecker.com or Mike Smithson’s PoliticalBetting.com, better known as “PB”. Just before the announcement, the individual bookies were considering the upcoming first round of the French Presidential election on 23 April, while Mike Smithson’s site was discussing the upcoming Manchester Gorton by-election and the chances of Francois Fillon in the French Presidential.
Bookmakers can react very quickly to upcoming events and many hold open political betting markets throughout the year, so the announcement was transparent from their point of view: the odds were already up or (in the case of constituency betting) would be up shortly afterwards
In total about 25 bookies offered on the 2017 General Election. For ease of calculation, we selected 10 Bet, Bet365, NetBet and Winner, and tracked them through the campaign. Their MAE and WIN over time looked like this:
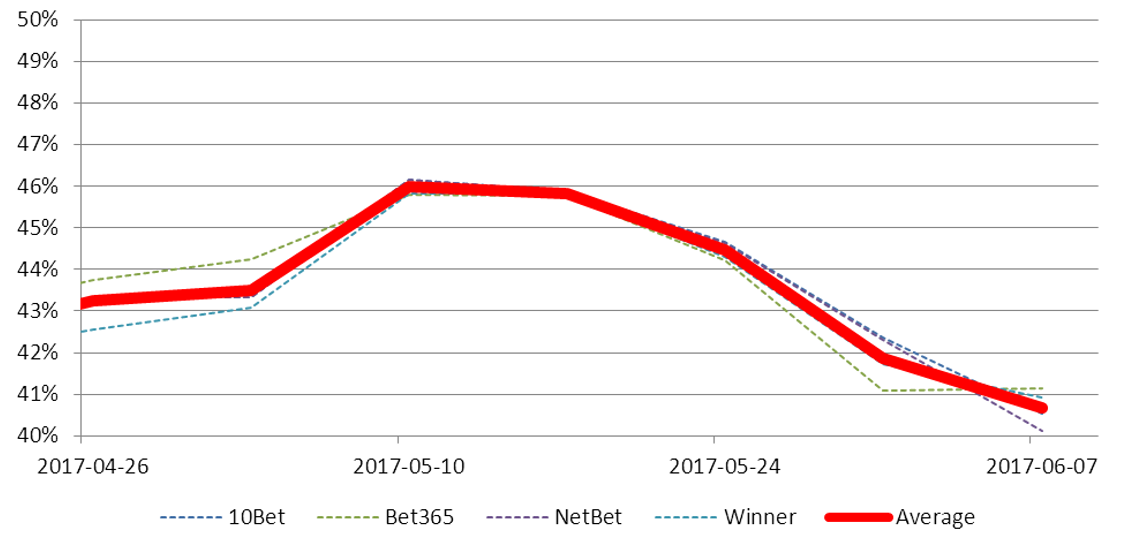
FIGURE 2 MAE for odds of overall majority between Wednesday 26 April 2017 and Wednesday 7 June 2017.
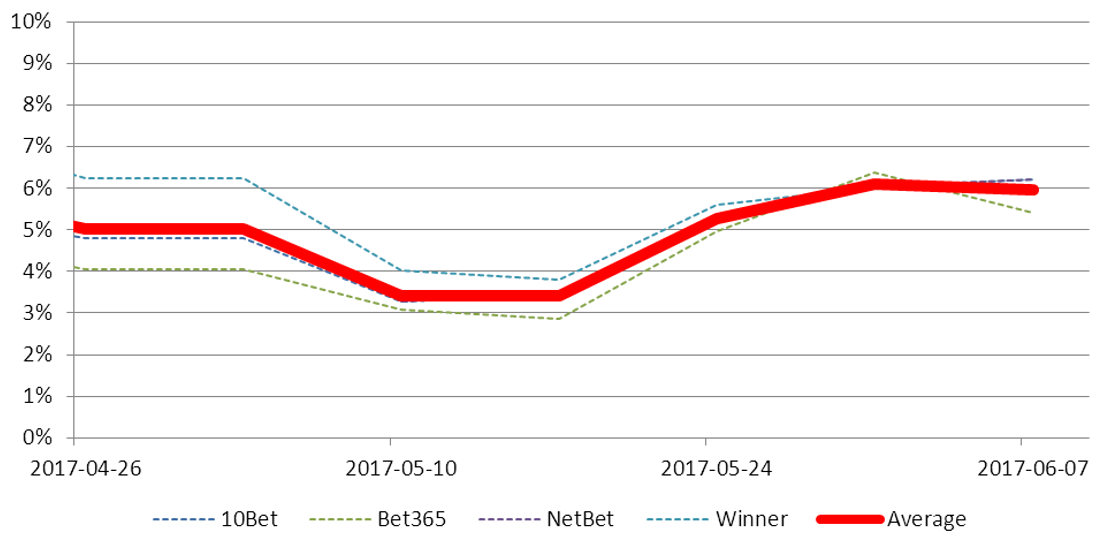
FIGURE 3 MAE for odds of most seats between Wednesday 26 April 2017 and Wednesday 7 June 2017.
TABLE 4 Total WIN for selected odds between Wednesday 26 April 2017 and Wednesday 7 June 2017.
| Date | 27 April | 3 May | 10 May | 17 May | 24 May | 31 May | 7 June |
| # correctly predicting no overall majority | 0/4 | 0/4 | 0/4 | 0/4 | 0/4 | 0/4 | 0/4 |
| # correctly predicting Con most seats | 3/3 | 3/3 | 4/4 | 4/4 | 4/4 | 4/4 | 4/4 |
As repeatedly stated, the bookmaker odds are not good predictors. The only thing stopping the MAE for overall majority climbing higher was that the bookmakers correctly identified the probability of a Labour or any other party majority to be effectively zero, so reducing the average error. The odds on most seats performed better, but were still worse than the non-bookmaker predictors.
The academics and analysts
Over the years an entire ecology of people has grown up to study elections and polls, and to make predictions. They range from academics such as Stephen Fisher at Oxford and Will Jennings at Southampton, to analysts such as Matt Singh and Martin Baxter. The best-known website is probably Martin Baxter’s ElectoralCalculus.co.uk, or Fisher’s ElectionsEtc.com or The Polling Observatory’s blog. Just before the announcement, the academics and analysts were making preparations for the scheduled 2020 election or thinking about other upcoming elections.
Academics and analysts generally took a few days to get their things in order to start making predictions, though some predictions came in pretty fast: Matthew Lebo (Stony Brook University) had coincidentally made a prediction the previous day and Martin Baxter keeps his predictions live and had one up by the end of 19 April. The rest trickled in thereafter, with the Polling Observatory putting the band back together (Ford/Jennings/Pickup/Wlezien) and Chris Hanretty resurrecting the “ElectionForecast” site as a solo project without Benjamin Lauderdale and Nick Vivyan.
There weren’t that many academics and analysts making predictions, so we captured what we could. We seriously considered Polling Observatory but they didn’t do seat predictions. So we selected Baxter, Fisher, Lebo, and Hanretty/Election Forecast, and tracked them through the campaign. Their MAE and WIN over time looked like this:
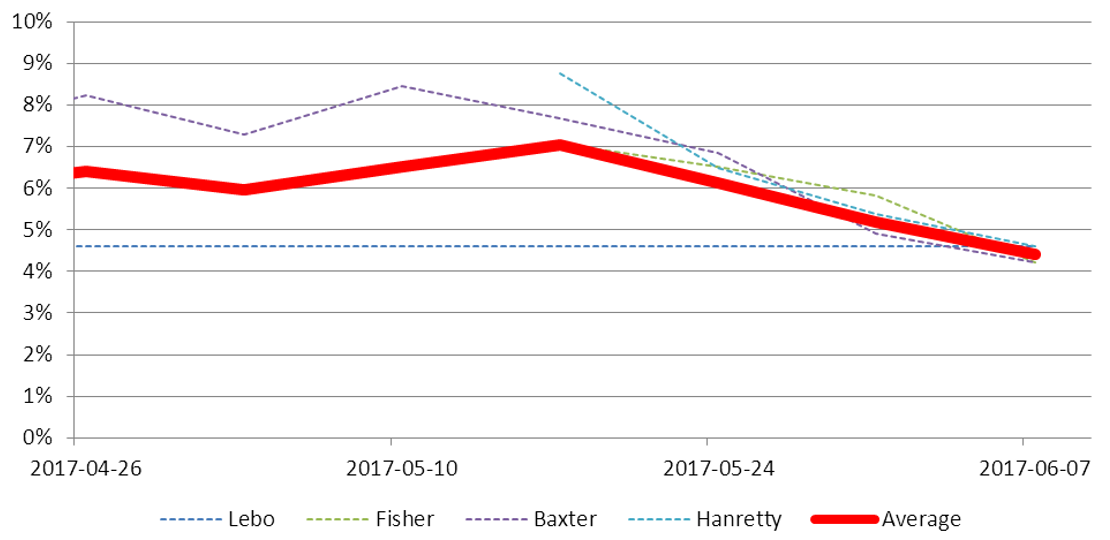
FIGURE 4 MAE for seat predictions between Wednesday 26 April 2017 and Wednesday 7 June 2017.
TABLE 5 Total WIN for seat predictions between Wednesday 26 April 2017 and Wednesday 7 June 2017.
| Date | 27 April | 3 May | 10 May | 17 May | 24 May | 31 May | 7 June |
| # correctly predicting Con most seats | 4/4 | 4/4 | 4/4 | 4/4 | 4/4 | 4/4 | 4/4 |
This was an indifferent performance by the academics and analysts. We were torn between congratulating them for getting the predictions set up and running in such a short time, and criticising the final outcome. We settled for acknowledging a danger that is not often remarked upon: it is relatively straightforward to make vote share predictions, but it is far more difficult to make seat predictions.
Prediction markets and spread betting
A prediction market is a market for predictions: a concept is introduced and a buy price and sell price are assigned. The buy and sell prices vary with market demand. A spread betting firm (in the meaning commonly held in Britain) looks very similar, with a varying buy and sell price, with the concept of “financial spread betting” becoming increasingly important. A third category – exchange betting – has a back and lay price and, again, appears similar but has differences. The distinction between the categories deserves an article of its own but for the moment we will simply note that although the differences may be important due to differing structure, legislation, oversight and taxation, for practical purposes this article will not distinguish between them. The best-known spread betting website is probably SpreadEx.com or SportingIndex.com, the latter commonly known as “SPIN”. The best-known prediction market is probably PredictIt.com. The best known exchange betting market is probably Betfair Exchange, not to be confused with the fixed-odds Betfair Sportsbook. Just before the announcement they were considering the French Presidential election and currency and share movements.
The firms by their nature can open markets quickly, and they put markets up on the election almost immediately. Unfortunately we could only capture a few, so our choices were constrained to what we could get. PredictIt did buy/sells on specific seat ranges and “next PM”, but both these markets were difficult to handle (“next PM: Boris Johnson”?) so we discarded it. Odds on number of seats from Betfair Exchange were also difficult to handle, so we discarded that as well. Consequently we selected SpreadEx, SPIN, and IG Index. Their MAE and WIN over time looked like this:
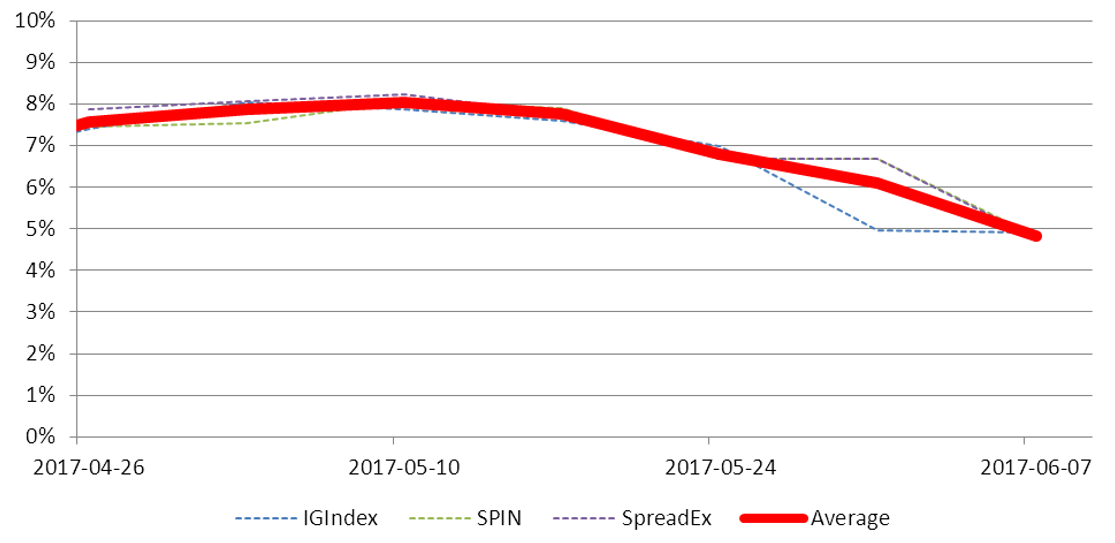
FIGURE 5 MAE of seat ranges between Wednesday 26 April 2017 and Wednesday 7 June 2017.
TABLE 6 Total WIN of seat ranges between Wednesday 26 April 2017 and Wednesday 7 June 2017.
| Date | 27 April | 3 May | 10 May | 17 May | 24 May | 31 May | 7 June |
| # correctly predicting Con most seats | 3/3 | 3/3 | 3/3 | 3/3 | 3/3 | 3/3 | 3/3 |
Again, this was not a good performance. But it does illustrate the advantages and disadvantages of the “wisdom of crowds approach”: without a singular conscious oversight, the mass of punters converged to a solution that was very like the academic and analyst predictions. But similarly it wasn’t that accurate: the crowd is not as wise as its reputation suggests. The question lingers: if the academics and analysts had not predicted or the pollsters not polled, would this have been different? We will never know.
The pollster-modellers
During the campaign an interesting hybrid appeared – the pollster-modellers. Models for election prediction were hardly unknown, but pollsters had usually issued… well, polls, as the name implies. But in this campaign YouGov and Lord Ashcroft both issued Multilevel Regression and Poststratification models: “MRP” for short, or “Mister P” colloquially. MRP is a modelling technique that takes the output from an opinion poll, traces the responses back to the people polled, notes their demographic and geographic characteristics, assigns a probability to those characteristics (“90% likelihood of male over 75 earning 60K in Surrey responding Con”), then weights that by the number of people with those characteristics in each area to come up with a prediction.
Because of interest generated by this methodology we separated the YouGov model and Ashcroft model out. Unlike the other predictors, they were not present at the start of this election period, and their predictions were not sampled prospectively but reconstructed retrospectively. Their MAE and WIN over time looked like this:

FIGURE 6 MAE for seat predictions between Wednesday 26 April 2017 and Wednesday 7 June 2017.
TABLE 7 Total WIN for seat predictions between Wednesday 26 April 2017 and Wednesday 7 June 2017.
| Date | 27 April | 3 May | 10 May | 17 May | 24 May | 31 May | 7 June |
| # correctly predicting Con most seats | 2/2 | 2/2 | 2/2 | 2/2 | 2/2 | 2/2 | 2/2 |
| # correctly predicting Con most votes | 1/1 | 1/1 | 1/1 | 1/1 | 1/1 | 1/1 | 1/1 |
This is much better: the YouGov model was a good predictor for vote share and an adequate one for seats. However praise must be counterbalanced by noting the somewhat poorer performance of the Ashcroft model. MRP is a not a panacea and decisions such as the method of turnout prediction remain vital.
The last day
By polling day, all the predictions were in. A full list of the final predictions is in the appendices. Displayed graphically, they look like this:

FIGURE 7 Average MAE of latest predictors for each category at Thursday 8 June 2017.
TABLE 8 Total number of predictors correctly predicting the winner for each category at Thursday 8 June 2017.
| Predictor | # of predictions | Average MAE | WIN |
| Exit poll (# seats) | 1 | 0.005 | 1/1 |
| Pollster-modellers (vote share) | 1 | 0.023 | 1/1 |
| Pollster-modellers (# seats) | 2 | 0.026 | 2/2 |
| Polls (vote share) | 11 | 0.030 | 11/11 |
| Preds & spreads (most seats) | 2 | 0.034 | 2/2 |
| Preds & spreads (# seats) | 3 | 0.041 | 3/3 |
| Analysts (# seats) | 11 | 0.044 | 11/11 |
| Odds (most seats) | 16 | 0.050 | 16/16 |
| Odds (overall majority) | 17 | 0.419 | 0/17 |
| Preds & spreads (overall majority) | 2 | 0.440 | 0/2 |
We can only repeat what we said earlier: this was not a good performance. There were some bright points, such as the performance of the pollster-modellers, and the outstanding performance of the exit poll (commissioned by the UK’s main broadcasters). The failure of the overall majority odds is not a new phenomenon: it is a blunt instrument that should not be relied upon for close elections. The polls weren’t actually that bad. But even so, you would not describe this as a spectacular success.
Conclusions
In 2010 the pollsters were reasonably settled as to their methodologies and achieved a decent result. In 2015 that comfort was shaken by their collective failure, and the 2016 EU referendum performance did little to help calm nerves. By 2017, the Sturgis inquiry had reported and the pollsters had a good idea of what they intended to do, and the snap election gave them a legitimate excuse for failure if things went wrong. It was an atmosphere that encouraged experimentation, and they promptly obliged with differing methods, a wide range of predictions, no herding and no bad-tempered Twitter spats. The day before was enlivened by a “stooshie” (their word) in the Survation offices over their final poll numbers: in the end they published and were not damned, getting it broadly right.
The bookies were expanding into a vacuum. The expansion of political betting in recent years meant that many odds were offered on many combinations: overall majority, most seats, next PM, constituency betting, financial indices, spread betting, prediction markets, fixed-odds gambling – a rich ecology where, whatever you wanted, there was a price to match and somebody willing to take your money. The problem was not acquiring data, it was deciding which data to discard.
By comparison, the academics didn’t have a bad election, but it wasn’t a good one either. It takes time to set up a model and they had short notice, so filler metrics such as polls-of-polls occasionally cropped up. But eventually there was a reasonable spread of predictions.
The most obvious trend was the triumph of Big Data. A 1980s poll would have been instantly recognisable to a classical statistician: a questionnaire taken face-to-face by a researcher, answers accumulated over several days and a mean produced, with the more daring assaying a confidence interval. But since then, face-to-face gave way to telephone polling, which is now giving way to online panel polling. The word “statistics” became conflated with “modelling”. The increased availability of open-source software and advances in storage and data access meant the amount of data coming in became bigger and the techniques and skilled workforce needed to handle them became available. The statistician running proprietary software, such as SAS or SPSS on a desktop, is being displaced by the modeller running open-source R on a laptop. The implications of the election were twofold, one good, one bad.
The first was the success of YouGov’s Multilevel Regression and Poststratification model. This model caused a negative reaction from partisans who wished to disbelieve its prediction of a hung parliament, and puzzlement from laymen who didn’t know what it meant (“So…it’s a poll, yes?” “Not quite”). But it was unambiguously successful.
The second was sadder: the failure of turnout models. There had been quite the fad for turnout models since 2015, with ComRes sticking to its ComRes Voter Turnout Model despite its performance in the referendum, and ICM also using a turnout model. But models will always have an Achilles’ heel: they are vulnerable to historically rare changes in behaviour. So when people began to notice that turnout models were giving the Conservatives a higher lead over Labour than self-reported likelihood to vote, it led to speculation regarding a mode effect. Sturgis and Jennings thought there might be such an effect, as did Anthony Wells, although he also thought it depended on whether non-BPC companies like SurveyMonkey were included. In the event, turnout models did not perform well, but given that there are known problems with self-reported likelihood to vote we assume that turnout models will not be abandoned but simply recalibrated.
Was this another polling debacle? The BPC acknowledges that the final polls were not ideal and we note that our MAEs were over the 2% threshold deemed acceptable for a four-party-forced. But is this sufficient? In previous articles we hypothesised that MAE increases with the number of parties predicted, although it’s more accurate to say the MAE changes as the number of parties predicted changes. So the concept of a constant threshold disappears. But we can compare the BPC’s own figures from 2017 to its own figures in 2015, as follows:
TABLE 9 BPC self-assessment of final polls for 2015 and 2017. See appendices for calculations.
| Format | MAE of BPC self-assessment 2015 | MAE of BPC self-assessment 2017 |
| Six-party-forced | 1.5 | 1.7 |
| Four-party-forced | 2.1 | 2.6 |
| Source | Source |
So, regardless of forced format, the poll predictions have gotten worse.
As stated at the outset, this was one of the most interesting elections in a long while. The implications for the country will be important, as the UK Government can now only command a majority in the new Parliament with the help of Northern Ireland’s DUP, so any Brexit negotiated settlement will need to be broadly palatable. But from a non-partisan point of view, this year’s vote gave indications to the future course of election prediction as new techniques and markets open up. Regardless of the political outcomes, the future for election prediction appears bright… although whether it will also be accurate is yet to be determined.
About the author
Timothy Martyn Hill is a statistician who used to work for the Office for National Statistics and now works in the private sector.
A fully referenced version of this article, with appendices, is also available.


