
But just how far can we trust the polls to give us an accurate read on the likely election outcome? As we have done for the 2015 UK general election and the 2016 EU referendum, we review the predictions for the previous presidential election, held in 2012, and note the errors that were made.
Not so simple
The election of the President of the United States is easily understood by most people: there are two candidates who stand for election throughout the US and the one who gets the most votes wins. The problem with that sentence is that every bit of it isn’t true. There are more than two candidates, they don’t all stand in every state, and the votes they cast are recommendations to 538 electoral college members, some of whom can and do ignore the public vote when casting their votes for President.
The complexity in the structure of the contest can make predictions difficult. It also invites a range of different prediction formats, which fall into three broad categories: electoral college predictors, vote share predictors, and probabilistic predictors. Respectively, these three different approaches predict the number of electoral college votes for each candidate, the percentage of the popular vote for each candidate and the probability that each candidate will win. Examples of predictors include betting odds, opinion polls and mathematical models.
To compare the performance of each type of predictor, we will select a maximum of five predictors from each category.
The candidates
As nominees of the two biggest political parties in the US, Clinton and Trump have attracted the vast majority of the election campaign coverage. But in this election, as in past elections, there are more than two candidates and more than two parties vying for the presidency. Post-war candidates achieving considerable fame or infamy include Ralph Nader (Green) in 2000, Ross Perot (independent) in 1992, John Anderson (independent) in 1980, George Wallace (American Independent Party) in 1968, and Strom Thurmond (States Rights Democratic Party) in 1948. In the 2016 election, candidates other than Clinton and Trump include Darrell Castle (Constitution), Gary Johnson (Libertarian) and Jill Stein (Green) – although Castle isn’t standing in enough states to win.
But regardless of their relative merits or their chances of victory, this article will not include these other candidates in its assessment of prediction accuracy. This is simply because there aren’t enough predictors for these candidates to merit their inclusion. Although some bookies, betting exchanges and spread bettors may include third-parties, some do not, and few polls and even fewer academic and other predictors include them in their forecasts.
To deal with those polls and predictors that do include results for third-parties, we adopt a two-party forced format in which predictions for these candidates (as well as any undecided voters) will be proportionally reallocated to the official Democratic and Republican candidates.
We briefly considered the merits of a one-party forced format: whether to force each prediction into a “will the incumbent party win or not?” format. It had the virtue of simplicity, particularly in respect of backward compatibility, but in the end we rejected it.
A prediction of a party without naming the candidate will be deemed to refer to the candidate of that party, even if the identity of the candidate later changes. This enables us to cope with predictions made before the candidate is known, and with cases where the candidate drops out before polling day.
Which metric shall we use to measure prediction error?
As in previous articles, mean absolute error (MAE) is our main choice of comparison. MAE is calculated as the average difference between what is predicted and the actual result. An accurate prediction will have an MAE of 0%, while a wholly inaccurate prediction will have an MAE of 100%. It or its variants are widely understood by pollsters and modellers and it can be used for any finite prediction that can be handled arithmetically.
However, as noted previously, there are problems with using MAE for a two-party-forced election, since it has no direction and doesn’t differentiate between an underestimated result and an overestimated result. So, in preparing this article, we examined three other metrics: the error of the Democratic lead (ELD), the error of the incumbent party lead (ELI), and whether the predictor actually predicted the winner (WIN). For a two-party-forced prediction the definitions of MAE, ELD, ELI and WIN are given below.
- MAE = Mean Absolute Error = [|prediction A – result A| + |prediction B – result B|]/2, where “A” is one candidate and “B” is the other candidate. Note that for a two-party-forced prediction, the MAE = |error of the lead/2|. Remember that, because it’ll become important later.
- ELD = Error of the Democratic lead = (prediction A – prediction B) – (result A – result B), where “A” is the Democratic candidate and “B” is the Republican candidate.
- ELI = Error of the incumbent party lead = (prediction A – prediction B) – (result A – result B), where “A” is the candidate from the incumbent party and “B” is the other candidate.
- WIN = Did it predict the winner? = “1” if the sign of (prediction A – prediction B) = the sign of (result A – result B), “0” if not. Again “A” is one candidate and “B” is the other candidate.
A brief investigation of the 2008 and 2012 elections showed that ELD wasn’t consistent over those two elections: the polls overestimated Obama's lead in 2008 but underestimated it in 2012. That same investigation showed that the polls underestimated ELI in 2008 and 2012, but a further check against polls from 1972 to 2008 showed that it generally couldn’t be relied upon, veering from an overestimation in 1996 to an underestimation in 2000. So we will omit ELD and ELI and calculate only MAE and WIN.
Our previous analyses suggest that an acceptable error for a UK General Election prediction is an MAE of no more than 2%: the elections of 2015 and 1992 had MAEs of 2.75% and 2.25% respectively and were labelled as “debacles”. We will note whether the predictors for the US presidential election meet this threshold on a two-party-forced basis.
Which results shall we measure the prediction against?
It is possible to extend presidential predictors back for many years: Nate Silver gives a summary of predictors back to 1992 and Ray Fair has been modelling since 1980. But we will restrict our analysis to one result: the 2012 presidential election.
The Democratic and Republican candidates for that election were Barack Obama and Mitt Romney respectively, and Obama won. The “result” is defined as the number of electoral college votes won (for electoral college predictions), the vote achieved (for vote share predictions), and “1” for the winner and “0” for the loser (for probabilistic predictions). The 2012 results were:
- Electoral college 2012 results. The raw electoral college votes before two-party-forced were 332 D, 206 R, 0 other, total 538. The results after two-party-forced were 0.617 D, 0.383 R, 0 other, total 1.
- Vote share 2012 results. The raw vote shares before two-party-forced were 51.06% D, 47.20% R, 1.74% other, 100% total. The results after two-party-forced were 0.520 D, 0.480 R, 0 other, total 1.
- Popular vote 2012 results. The raw popular votes before two-party-forced were 65,915,795 D, 60,933,504 R, 2,236,111 other, total 129,085,410. The results after two-party-forced were 0.520 D, 0.480 R, 0 other, total 1.
- Post-facto probabilities of the 2012 election. Obama won, so the post-facto probabilities in two-party-forced format was 1 D, 0 R, 0 other, total 1.
The predictors selected will be for the week on/before polling day of Tuesday, 6 November 2012.
The predictors
Opinion polls
Polls provide a means of asking people who they intend to vote for and, just as in the UK, a US poll can be conducted using different methodologies, which can give different results. Those methodologies include:
- Online polls. These are conducted online, via an online panel compiled by the pollster, via companies such as SurveyMonkey, or by other methods such as repurposing a pre-existing panel built by somebody other than the pollster.
- Telephone polls. These are conducted via telephone and random dialling, with some variants including mobiles or using techniques like robodialling.
- Face-to-face polls. These polls are conducted by an interviewer speaking to someone in person.
Whereas the UK is relatively small and densely packed, the US is a big country with some sparsely-populated areas and a much larger electorate: in 2012 it had 235 million people eligible to vote and 129 million valid votes were cast. Polls in the UK usually cover England, Wales and Scotland and have begun to correct their historical neglect of Northern Ireland, but polls in the US cover two distinct geographies:
- Nationwide polls, covering all 50 states plus DC.
- Statewide polls, covering an individual state.
The statewide polls will not be considered in this article. Whether 50 individual state polls are better or worse than one nationwide poll is a matter of debate.
Betting odds
Gambling takes place at different times, in different jurisdictions, uses different words and is covered by different legislation and oversight. This is a problem for this article because some US terms (moneyline, sportsbook, vigorish, spreads, over/under) are used rarely or differently in the UK. To try to get around this we will set out our terminology here and use British usage or invented terms to avoid ambiguity.
We will use the word “punter” to describe someone who wants to make a bet, the word “bookie” for the person who takes the punter’s money, and the word “book” to describe the set of all odds on a given event offered by the bookie at a given moment. The book can be translated into probabilities (for a description of this process and the “overround”, see a previous article). Bookies fall into the following categories:
- Fixed-odds betting. We will use the phrase “Fixed-odds bookie” to describe a bookie who will offer a single fixed-odds to a punter for a price (the “stake”) and return the stake and additional money (the “winnings”) to the punter if successful. Here bookies derive their profit from the overround.
- Spread betting (two numbers defined). Here the bookie offers not a single fixed-odds but a buy price and a lower sale price, with the “spread” being the difference between the buy and sell. The spread is always greater than zero but the buy and sale price varies up and down according to demand. In spread betting on finite events, the bookie settles the bets at the end of the event, with bets bought back at pre-established prices (which can be zero). The bet can be constrained to vary between a minimum (usually zero) and maximum price (say 100 or 1). Here bookies derive their profit from the spread. This definition of “spread betting” is common in the UK.
- Spread betting (spread defined). This also involves the difference between two numbers, but instead of the two numbers being specified (the buy and sell price) and the spread derived from them, the spread is stated directly (“a spread of four points”) without being attached to specific end points. Again, bookies derive their profit from the spread.
- Exchange betting. In this variant we have one punter who wants to risk a sum at a given odds, another punter who wants to cover that bet for that sum, and the “betting exchange” acts as a matchmaker bringing the two together. Betting exchanges derives their profit from a commission from each punter. Just as Uber owns no cars, Trivago owns no hotels, and AirBnb owns no rooms, a betting exchange can be entirely virtual and stake no money of its own.
Academic and other predictors
In the UK, academic and other predictors exist and are rapidly increasing, but arguably the US exceeds them both in number and in longevity: for example, the Fair model dates back to 1980. Pollyvote groups these US predictors into the following categories:
- Prediction markets. A “prediction market” is simple: you bet on a future event, so it’s a form of gambling or futures trading. Political prediction markets are illegal in the US but exceptions are made in two cases, PredictIt and Iowa Electronic Markets. Political prediction markets outside the US are not covered by US legislation although those that sell online to US citizens may come under pressure to close (Intrade, for example).
- Econometric models. An econometric model is a mathematical model with the dependent variable being the election outcome, and the independent variables being economic conditions and opinion polls. (Nate Silver has reservations regarding econometric models.)
- Index models. These are similar to econometric models, though the independent variables may differ and/or include criteria such as issues of the day.
- Expert predictors. Avowed experts make predictions for who they think will win the election.
- Citizen forecasts. Non-experts make predictions for who they think will win the election.
- Poll aggregators. These aggregate existing polls to produce a “poll-of-polls”.
Errors for opinion polls
We captured nationwide opinion polls immediately before the 2012 presidential election and selected the five which we could most consistently retrieve over 2008, 2012 and 2016. They were:
- ABC News/Washington Post (conducted by Langer Research Associates), a phone poll including cellphones.
- CNN (by Opinion Research Corporation), a phone poll including cellphones.
- Rasmussen (by Pulse Opinion Research, LLC), a robocall/internet poll omitting cellphones.
- Reuters (by Zogby in 2008, Ipsos thereafter), an internet poll.
- NBC News (Wall Street Journal & Hart Research Associates, or SurveyMonkey), a phone poll including cellphones.
We then calculated the MAE for these nationwide polls and the results are displayed in the table below:
Table 1. Vote share predictions from nationwide opinion polls, 2012. All results in two-party-forced format.
| Poll | Dem predicted | Dem result | Rep predicted | Rep result | MAE | WIN |
|---|---|---|---|---|---|---|
| Rasmussen | 0.495 | 0.520 | 0.505 | 0.480 | 0.025 | 0 |
| CNN | 0.500 | 0.520 | 0.500 | 0.480 | 0.020 | 1 |
| Reuters | 0.505 | 0.520 | 0.495 | 0.480 | 0.015 | 1 |
| ABC News/ Washington Post | 0.505 | 0.520 | 0.495 | 0.480 | 0.015 | 1 |
| NBC News | 0.505 | 0.520 | 0.495 | 0.480 | 0.015 | 1 |
We see that for our small selection, the 2012 predictions underestimated the lead of the incumbent party (Democratic), and that the MAEs were within the 2% threshold for an acceptable UK General Election, with one exception (Rasmussen). Four out of the five predictors correctly predicted an Obama win, albeit marginally by CNN (who predicted a draw).
Errors for betting odds
We captured betting odds immediately before the 2012 presidential election and selected five from just before the election (in contradistinction to “in-play” odds on the day of the election itself, which vary too fast to be useful), with a view to comparison to later elections. They were:
- Betfair, a London-based bookie that covers both fixed-odds and exchange betting (as “Betfair Exchange”).
- Intrade, a Dublin-based bookie that covers exchange betting. Ceased trading in 2013.
- Ladbrokes, a London-based bookie that covers fixed-odds.
- William Hill: a London-based bookie that covers fixed-odds.
- PaddyPower, a Dublin-based bookie that covered fixed-odds. Merged with Betfair in 2016.
We then calculated the MAE for those captured odds and the results are displayed in the table below:
Table 2. Probability predictions from betting odds, 2012. All results in two-party-forced format.
| Bookie | Dem predicted | Dem result | Rep predicted | Rep result | MAE | WIN |
|---|---|---|---|---|---|---|
| Betfair | 0.771 | 1.000 | 0.229 | 0.000 | 0.229 | 1 |
| Intrade | 0.670 | 1.000 | 0.330 | 0.000 | 0.330 | 1 |
| Ladbrokes | 0.789 | 1.000 | 0.211 | 0.000 | 0.211 | 1 |
| William Hill | 0.789 | 1.000 | 0.211 | 0.000 | 0.211 | 1 |
| PaddyPower | 0.724 | 1.000 | 0.276 | 0.000 | 0.276 | 1 |
These errors reinforce observations in our previous articles: probabilistic predictions such as fixed-odds have much larger MAEs than vote-share predictions. These MAEs are far outside the 2% threshold for an acceptable UK General Election. However, all five predictors correctly predicted an Obama win.
Errors for academic and other predictors
We captured academic and other predictors immediately before the 2012 presidential election and selected the five which we could most consistently retrieve over 2012, and then match to 2016. We also picked a sixth: Lichtman’s “13 Keys”, one of the few binary predictors which just selects a winner with no numeric qualification. The selected predictors were:
- Alan Abramowitz’s Time for Change model. This predictor uses presidential approval rating, economic factors, incumbency and voting polarisation.
- Robert Erikson and Christopher Wlezien, who use economic indicators and opinion polls.
- Ray Fair’s Fair model. This predictor uses economic indicators and a few non-economic ones, such as incumbency and whether the country is at war.
- Allan Lichtman’s 13 Keys to the White House. A binary predictor based on thirteen binary Yes/No indicators (“Is there a significant third-party candidate?”). When six or more are false, the incumbent party loses.
- Helmut Norpoth and Michael Bednarczuk’s Primary model. In 2012 this predictor used incumbency and the New Hampshire primary.
- Nate Silver of FiveThirtyEight.
We then calculated the MAE for those predictors and the results are displayed in the table below:
Table 3. Vote share predictions from academic and other predictors, 2012. All results in two-party-forced format.
| Predictor | Dem predicted | Dem result | Rep predicted | Rep result | MAE | WIN |
|---|---|---|---|---|---|---|
| Abramowitz | 0.506 | 0.520 | 0.494 | 0.480 | 0.014 | 1 |
| Erikson and Wlezien | 0.526 | 0.520 | 0.474 | 0.480 | 0.006 | 1 |
| Fair | 0.490 | 0.520 | 0.510 | 0.480 | 0.030 | 0 |
| Lichtman* | 1.000 | 1.000 | 0.000 | 0.000 | 0.000 | 1 |
| Norpoth and Bednarczuk | 0.532 | 0.520 | 0.468 | 0.480 | 0.012 | 1 |
| Silver | 0.513 | 0.520 | 0.487 | 0.480 | 0.007 | 1 |
*binary prediction, not a vote-share prediction
We see that for this selection the errors are small with no obvious pattern with respect to under- or over-estimation, and again the MAEs are within the acceptable 2% threshold, with one exception (Fair). Note that since Lichtman’s binary predictor correctly identified the winner and nothing else, his error is zero. Five of our six predictions correctly predicted the winner.
Errors for all predictors
If we depict all the errors from the previous sections on one graph, we see the following:
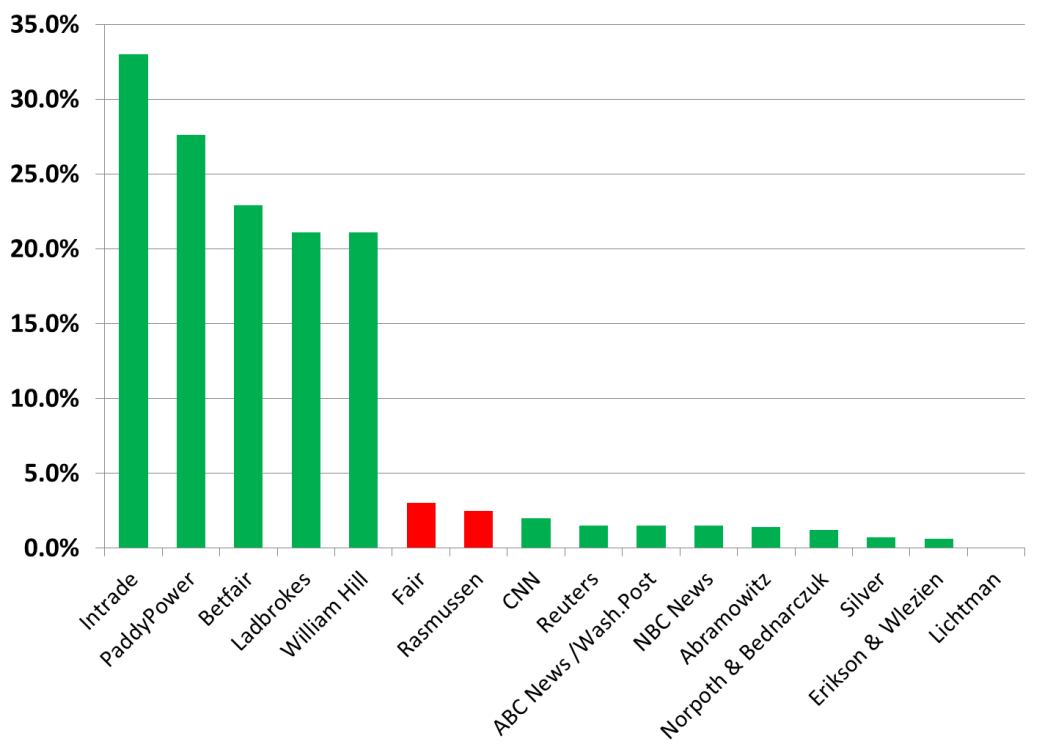
Figure 1. All errors for selected 2012 predictors. MAE = |error of the lead/2|. Green correctly predicted an Obama win, Red incorrectly predicted a Romney win.
We find that the MAE of the betting odds is prohibitively large and illustrates a quandary previously encountered: the problem with the MAEs of probabilistic predictions is not how to calculate them, but how to fit them on the graph. The polls and other predictors did considerably better, being mostly within the 2% two-party-forced (2PF) MAE threshold acceptable for a UK General Election. However, all our selected betting odds accurately predicted an Obama win, whereas the Fair model and Rasmussen polls incorrectly predicted a Romney win.
It would seem that the predictors are accurate on the gross scale (“do they actually predict the winner?”), but less accurate on a finer analysis (“how well do they predict the outcome?).
Applying the error to 2016
Older readers may remember the glory days of by-election coverage on BBC Newsnight by Peter Snow, who used to end his sessions by applying the vote swing from party to party to all the UK constituencies, a process which would inevitably end in an implausible landslide for one side or another. It wasn’t psephological science but psephological theatre, but it was compelling nonetheless and it leads us to ask: “What would happen if we applied the 2012 errors to our 2016 predictions?”
So let’s do just that. Let’s take our 2016 predictors as they stand today and see what happens if we apply the 2012 MAEs to them. Remember we said that the equation “MAE = |error of the lead/2|” for a 2PF prediction was important? If we rearrange that equation to give “error of the lead = ±2*MAE” we can work out what the errors of today’s predicted leads might be if they are as inaccurate as they were last time.
We selected predictors for Clinton/Trump that matched predictors for Obama/Romney and extracted their values immediately on/before Sunday, 18 September 2016, which is 51 days before polling day. We list them in the table below and apply the 2012 errors to our 2016 predictions.
Table 4. 2016 predicted leads, adjusted by their matching 2012 error. SoError of the lead = ±2*MAE.
| Type | Predictor | 2016 Dem (raw) | 2016 Dem (2PF) | 2016 Rep (raw) | 2016 Rep (2PF) | 2016 Dem lead (2PF) | 2012 MAE | 2016 Dem lead minus 2*2012 MAE | 2016 Dem lead plus 2*2012 MAE |
|---|---|---|---|---|---|---|---|---|---|
| Odds | PaddyPower | 1.530 | 0.638 | 2.700 | 0.362 | 0.277 | 0.276 | -0.275 | 0.829 |
| Odds | William Hill | 1.570 | 0.603 | 2.380 | 0.397 | 0.205 | 0.211 | -0.217 | 0.627 |
| Odds | Betfair | 1.530 | 0.631 | 2.620 | 0.369 | 0.263 | 0.229 | -0.195 | 0.721 |
| Odds | Ladbrokes | 1.570 | 0.614 | 2.500 | 0.386 | 0.229 | 0.211 | -0.193 | 0.651 |
| Other | Fair | 0.440 | 0.440 | 0.560 | 0.560 | -0.120 | 0.030 | -0.180 | -0.060 |
| Poll | Rasmussen | 0.400 | 0.488 | 0.420 | 0.512 | -0.024 | 0.025 | -0.074 | 0.026 |
| Poll | CNN | 0.480 | 0.495 | 0.490 | 0.505 | -0.010 | 0.020 | -0.050 | 0.030 |
| Other | Abramowitz | 0.514 | 0.514 | 0.486 | 0.486 | 0.028 | 0.014 | 0.000 | 0.056 |
| Other | Nate Silver | 0.469 | 0.510 | 0.451 | 0.490 | 0.020 | 0.007 | 0.006 | 0.034 |
| Poll | NBC News | 0.480 | 0.522 | 0.440 | 0.478 | 0.043 | 0.015 | 0.013 | 0.073 |
| Poll | Reuters | 0.420 | 0.525 | 0.380 | 0.475 | 0.050 | 0.015 | 0.020 | 0.080 |
| Other | Norpoth and Bednarczuk | 0.525 | 0.525 | 0.475 | 0.475 | 0.050 | 0.012 | 0.026 | 0.074 |
| Other | Erikson and Wlezien | 0.520 | 0.520 | 0.480 | 0.480 | 0.040 | 0.006 | 0.028 | 0.052 |
| Poll | ABC News/ Washington Post | 0.510 | 0.543 | 0.430 | 0.457 | 0.085 | 0.015 | 0.055 | 0.115 |
These figures, depicted graphically, look like this:
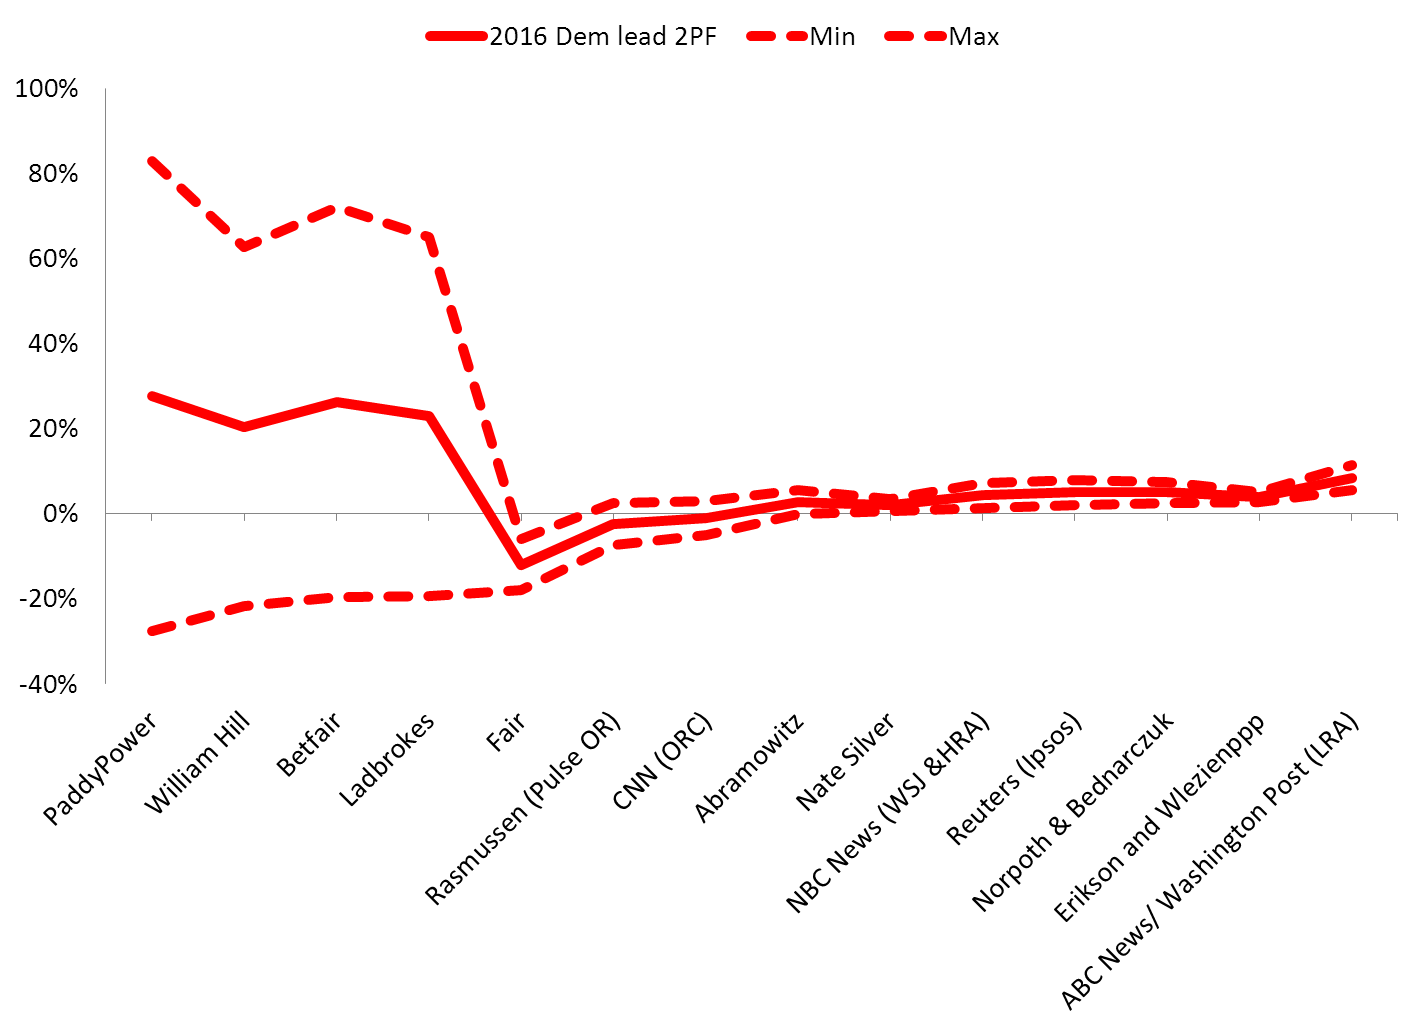
Figure 2. Range of the 2016 Democratic lead derived from 2016 predictors, adjusted by 2012 MAE. Above the line is a predicted Democratic lead, below is a predicted Republican lead.
This isn’t probability theory: we aren’t using margin of error or variance here. This figure is simply an illustration of what would happen if our 2016 predictions (as of September 18 2016, 51 days before polling day) were as inaccurate as they were in 2012 (just before the vote). But it does illustrate that despite the common belief that Clinton is winning, it is entirely possible that Trump may yet clinch it.
- Timothy Martyn Hill is a statistician who used to work for the Office for National Statistics and now works in the private sector.
- Download a PDF version of this article, with inline references and appendices.


