
Bill Shankly, a former manager of Liverpool Football Club, once said: “Some people believe football is a matter of life and death. I’m very disappointed with that attitude. I can assure you it is much, much more important than that.” Many die-hard fans of the sport would agree. But as much as they might love “the beautiful game”, some will tell you that… well, it’s not always that exciting to watch.
Of course, excitement, like all emotions, is subjective and depends a lot on context. Most fans come to see goals being scored, and the more scored by your team the better. But a match that ends in a goalless draw can be a thrill-a-minute nail-biter, especially if your team needs a draw to win the league but your best defender is out with injury.
So, there are plenty of individual examples of exciting games, and some boring examples, too. What we are interested to know is whether English league football has become less exciting over time, as this is a view sometimes expressed by football fans. To address the question of excitement, we build easily produced visualizations, and fit change-point statistical models working in the Bayesian framework.
Rules, goals, draws and excitement
As with all organised sports, football is governed by rules, and these play a large part in determining whether the sport is exciting or not. Some, for example, have argued that the rule preventing teams making more than three player substitutes per match should be changed to make games more exciting. Others disagree, arguing that the limit on substitution forces more strategic thinking from managers and their teams. (In fact, the rules on substitutes have been modified very recently to allow up to five substitutes for the rest of the 2020/21 season.)
Football rules haven’t changed much over time, but there have been some salient events in the sport’s recent history. For example, in 1981 an important modification was made to the system that allocates points to the outcome of a match. These points, totalled over all matches in a season, go a long way to determining a team’s final league position. Before 1981, teams received 2 points for a win, 1 for a draw, and 0 for a loss. From 1981, however, 3 points were awarded for a win (3PFAW) in the English Football League, and it was hoped that this change would encourage teams to “go all out” for a win, rather than to “shut up shop” for a draw, potentially making games more exciting. (The flip side of this, of course, is that teams who have a narrow lead may become more defensive in order not to reduce their 3 points to 1.)
Many studies and reports have investigated the impact of the introduction of 3PFAW.1, 2, 3 We continue this work here, by looking at the number of goals scored in matches, and whether there is any evidence of this changing at the time 3PFAW was introduced, using number of goals scored as a proxy measure for excitement.
Figure 1 shows the average number of goals per match in each season for all four league tiers. (League tiers are defined in Table 1, which also lists some key events in the history of the English Football League.) A loess smoother has been added as an indication of trend. For tiers 1 and 2, we see a decrease in the average number of goals per match up to the start of World War I, followed by an increase. All tiers show a decrease since 1958, perhaps indicating a shift to a more defensive style of play, followed by a recent stabilization or even an increase, notably in tier 1. Some additional discussion, including mention of the average number of passes per game, can be found here.
Table 1: The English Football League tiers, and how they have changed over time (with key events in shaded rows).
|
|
Tier 1 |
Tier 2 |
Tier 3 |
Tier 4 |
|
1888 |
Football League |
– |
– |
– |
|
1892 |
Division 1 |
Division 2 |
– |
– |
|
1915-1918 |
Football League suspended during World War I |
|||
|
1920 |
Division 1 |
Division 2 |
Division 3 |
– |
|
1921 |
Division 1 |
Division 2 |
Division 3 North Division 3 South |
– |
|
1925 |
Offside rule modified |
|||
|
1940-1944 |
Football League suspended during World War II, |
|||
|
1945 |
Division 1 North Division 1 South |
– |
– |
– |
|
1946 |
Division 1 |
Division 2 |
Division 3 North |
– |
|
1958 |
Division 1 |
Division 2 |
Division 3 |
Division 4 |
|
1981 |
3PFAW rule introduced |
|||
|
1986 |
Play-offs introduced |
|||
|
1990 |
Offside rule modified |
|||
|
1992 |
Premier League |
First Division |
Second Division |
Third Division |
|
2004 |
Premier League |
Championship |
League One |
League Two |
|
2016 |
The Football League officially becomes the English Football League |
|||
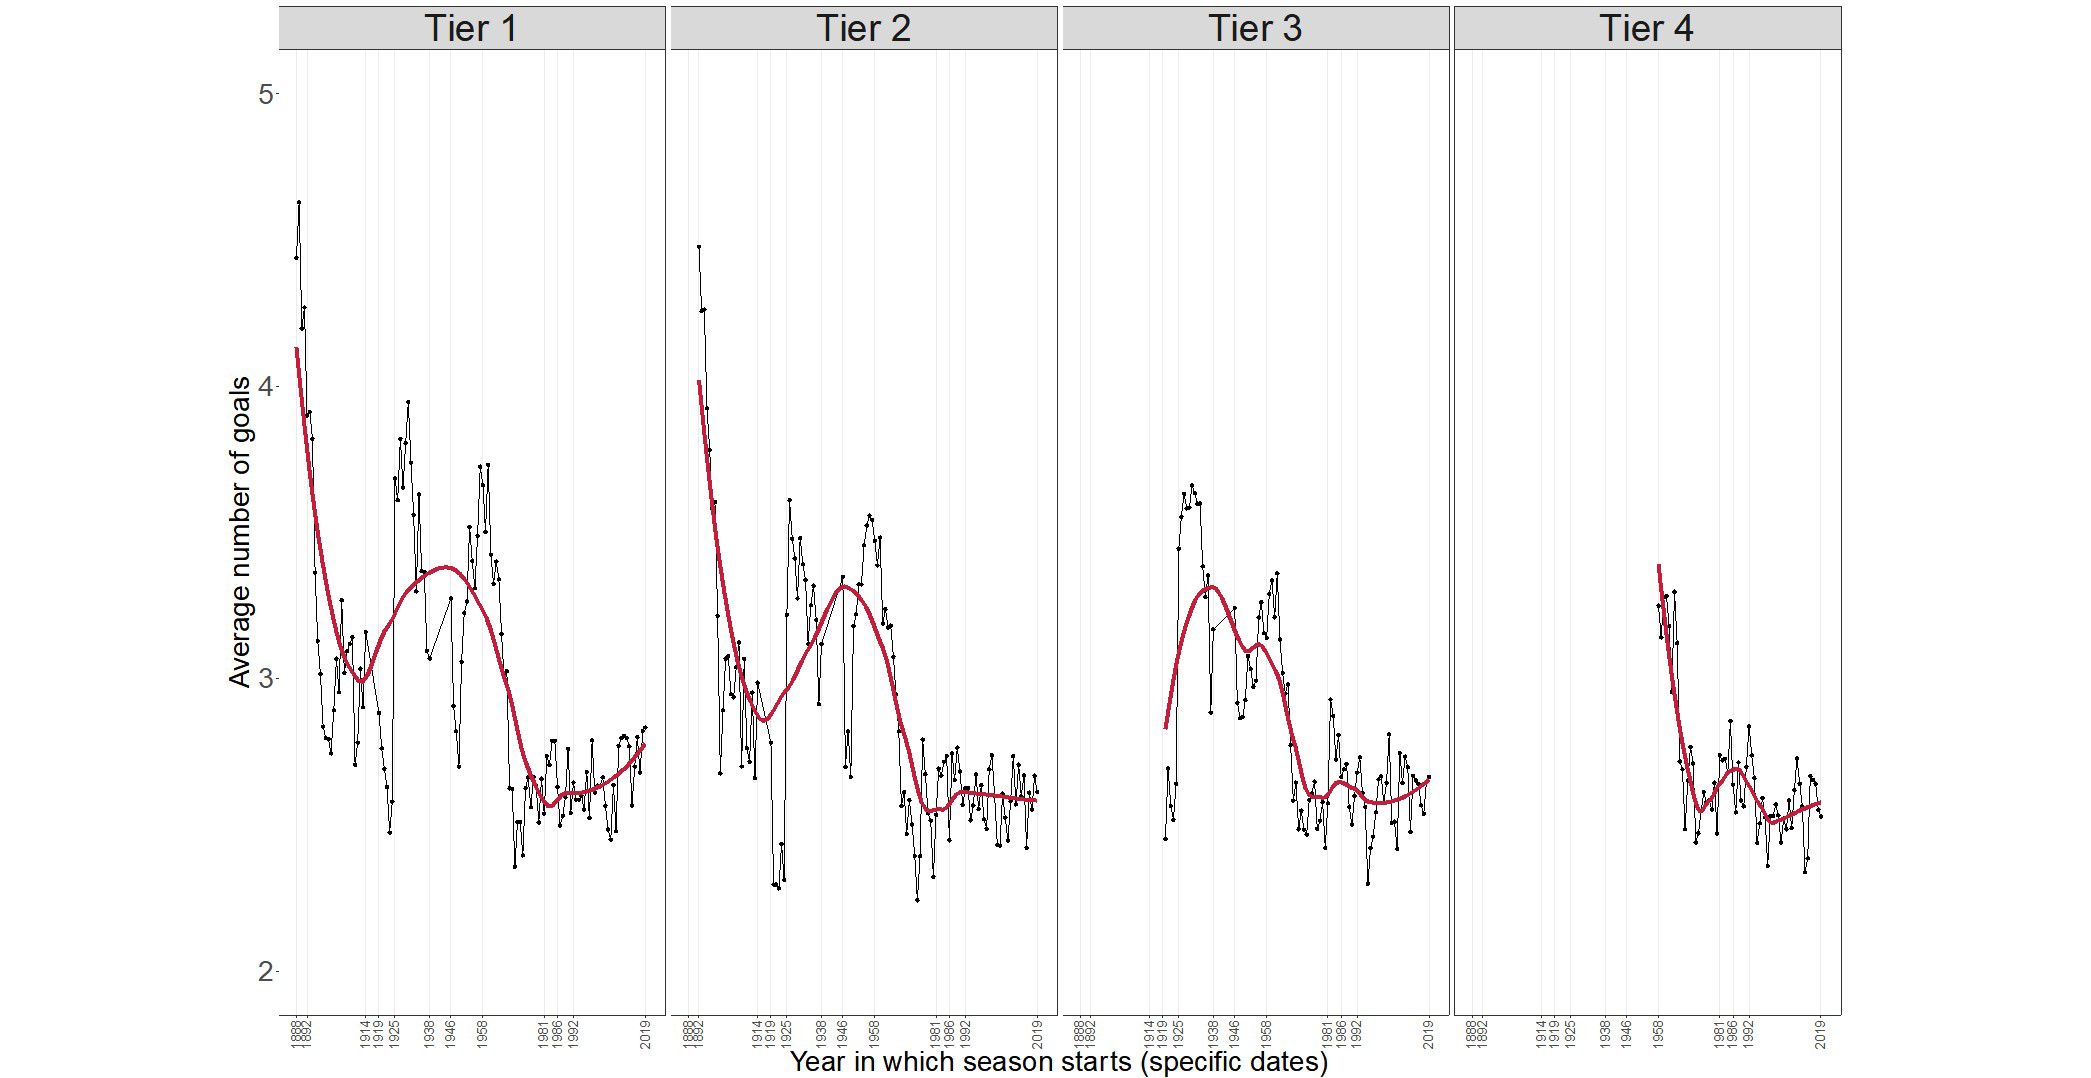
Figure 1: The average number of goals per match in each season for all four tiers of the English football league. A loess smoother has been added in each panel. (Click image to enlarge.)
In Figure 2, we focus on the period from the 1958 season, when all four tiers were operational, and show the results of a Bayesian change-point analysis on the average number of goals per match.
We developed a Bayesian change-point analysis methodology in a geoscience context4 using BUGS.5 Here, we performed our analyses following these methods in Stan, using the rstan R package. Our implementation was based on the discussion, that can be found here, of Poisson change-point models for coal mining disasters, except that we extended the methods to allow a different simple linear regression model for the seasonal average number of goals per match either side of the change-point.
For each league tier, the probability distribution that a change-point occurs in a given season is shown in the left column of Figure 2. The change-points corresponding to the means of this distribution are 1969, 1975, 1969 and 1966 for tiers 1 to 4. These change-points are shown in the right column of Figure 2, together with the fitted simple linear regression models, and mark a period of decline followed by some stabilization or perhaps slight improvement. The posterior mean slopes before/after the change-point are –0.08/0.003, –0.08/–0.001, –0.05/0.000, –0.02/–0.002 for tiers 1 to 4. All change-points occur considerably before the 3PFAW modification in 1981 and are close (except in tier 2) to the England football team’s victory in the 1966 World Cup. This victory had a positive effect on English football, which was considered to be in a period of general decline before that, as discussed by sports writer Paul Brown.
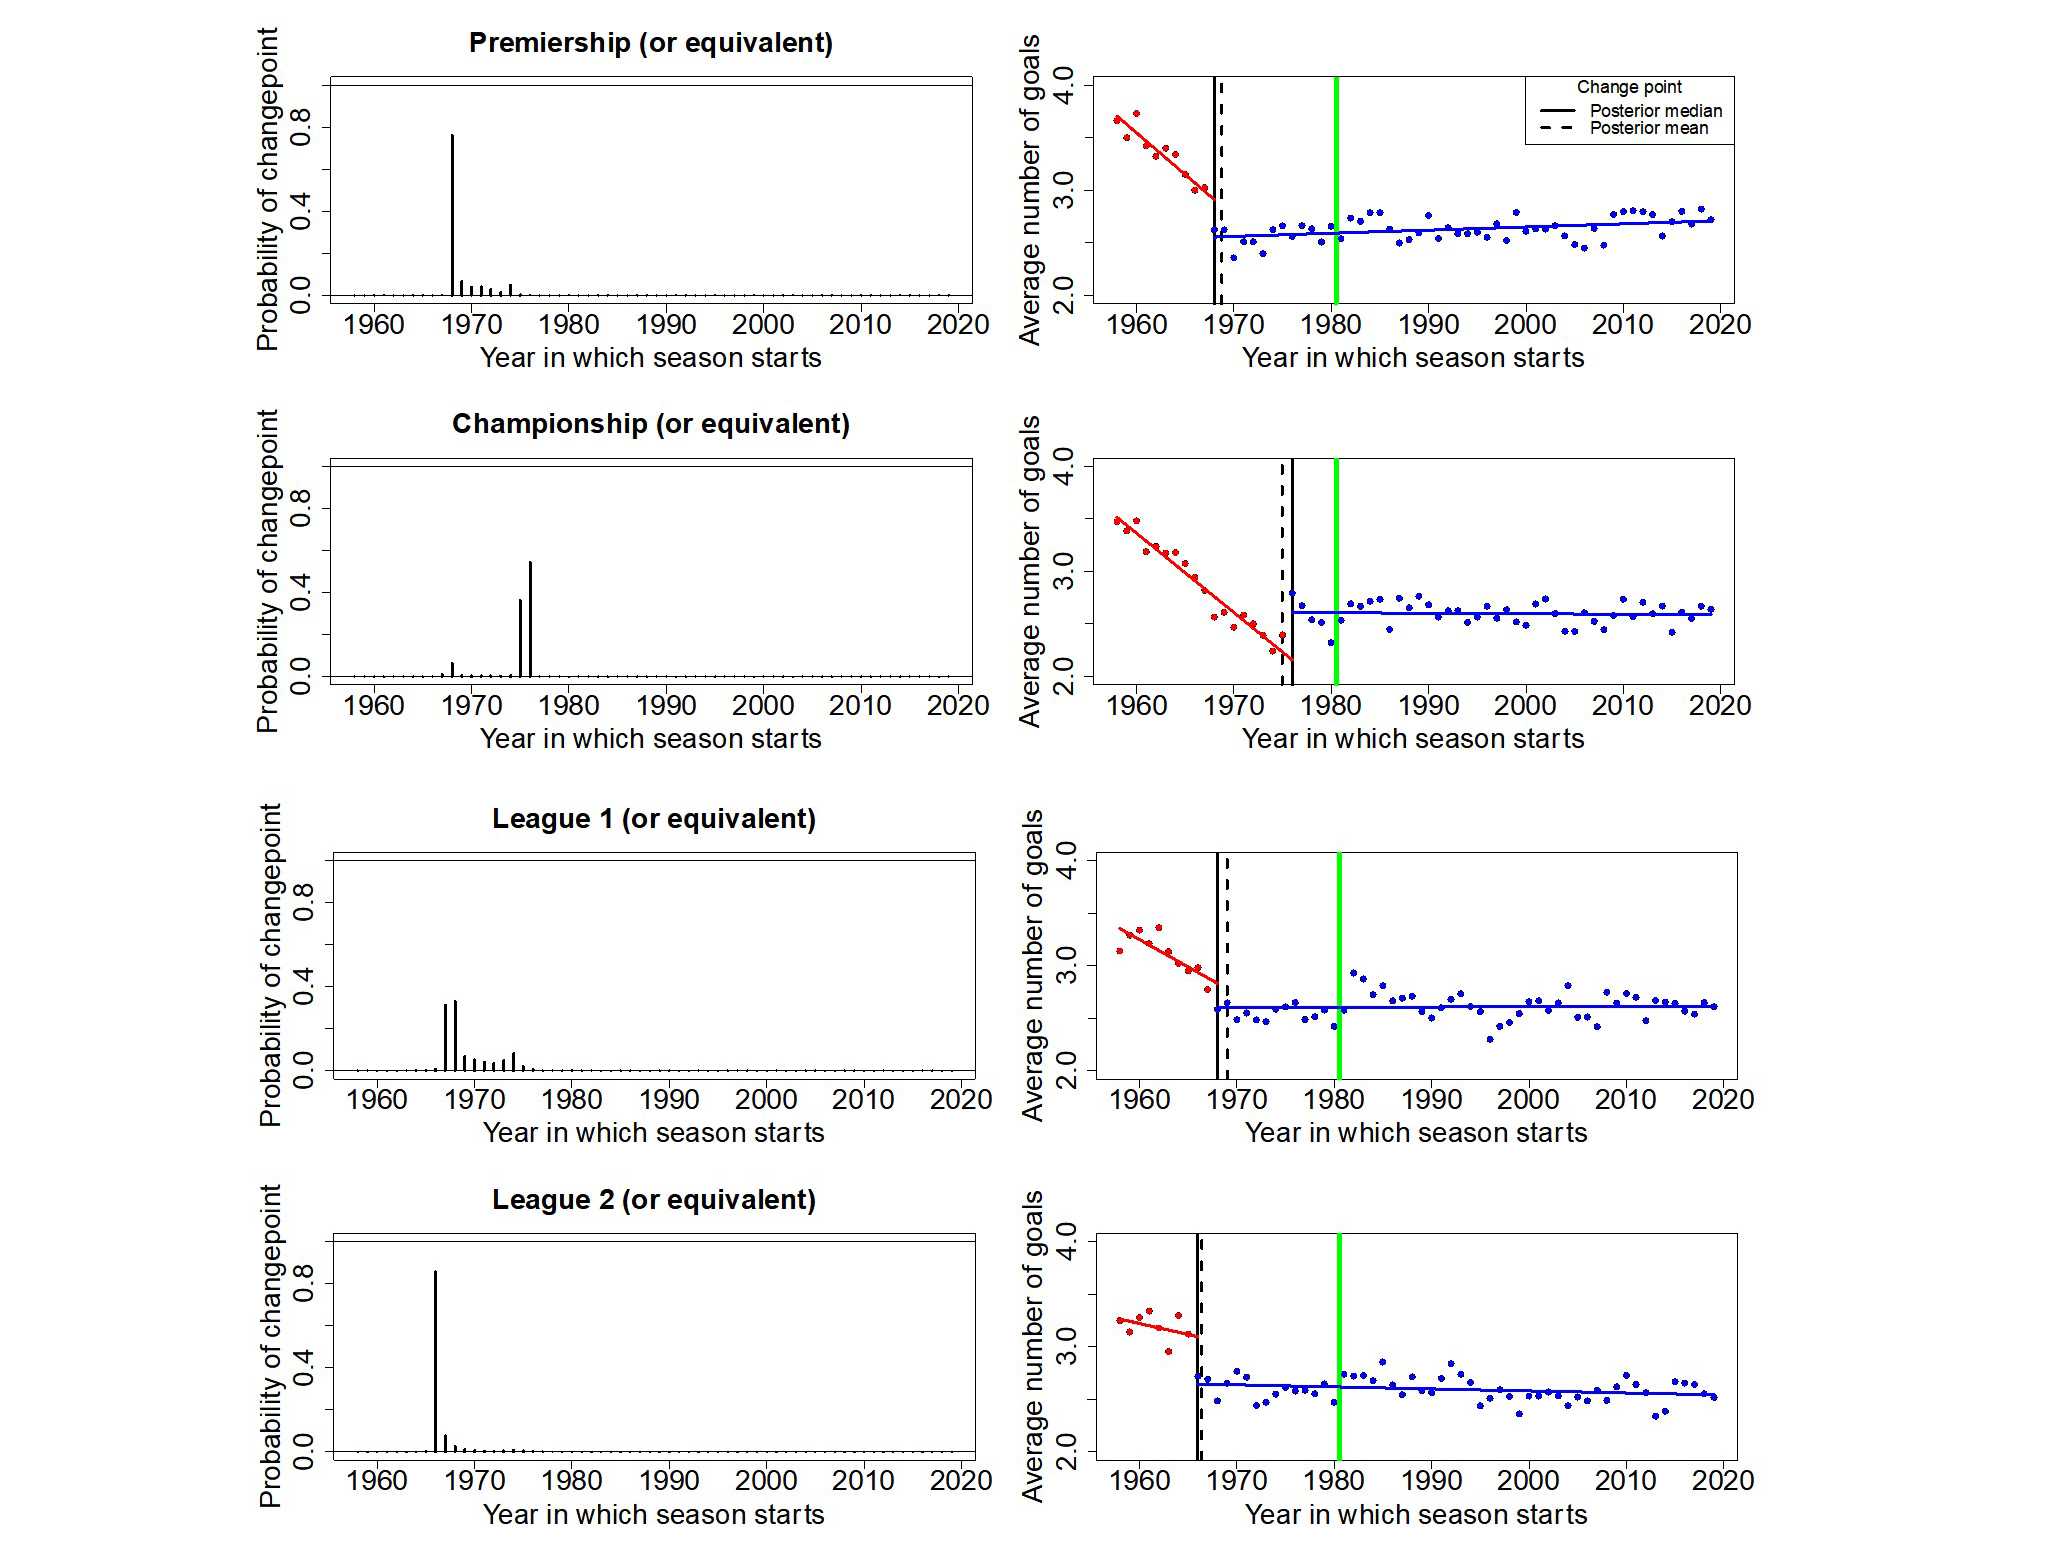
Figure 2: The probability distribution that a change-point occurs in a given season is shown in the left column. The right column shows the posterior median and mean change-points together with the simple linear regression models fitted to the average number of goals per match each season either side of the median change-point. The change-points occur considerably before the green vertical line that indicates when the 3PFAW modification occurred. (Click image to enlarge.)
The proportion of matches that finish in a draw has been the subject of much discussion. This proportion is shown for each season and for each league tier in Figure 3. It could be argued that the higher the proportion of draws, the less exciting the season, especially if the draws involved low scores. The proportion of draws has generally increased over time, which might therefore indicate a reduction in excitement. Excitement may, however, have increased – as draws decreased – between the World Wars. Recently there has been some stabilization and even a decrease in the number of draws in tiers 1, 3 and 4.
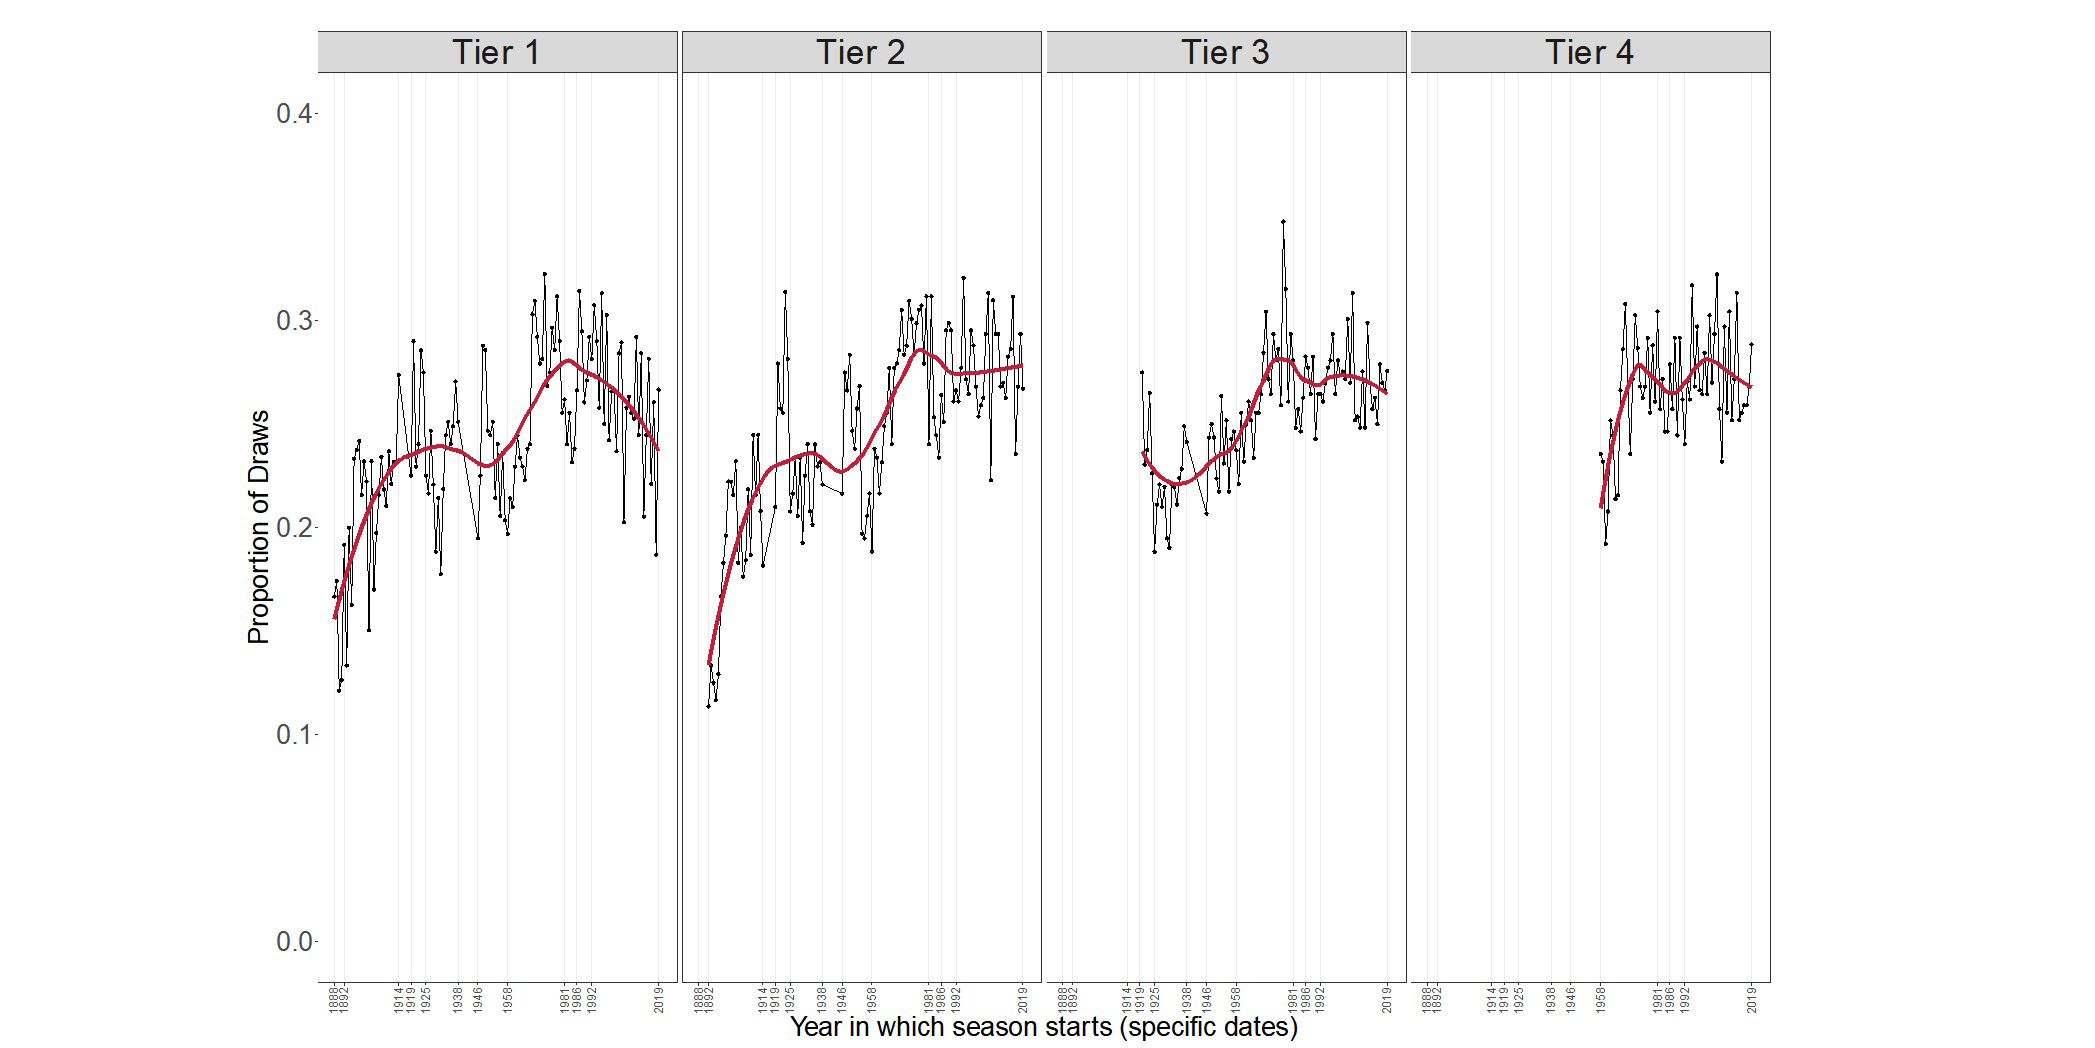
Figure 3: The proportion of drawn matches in each season for all four tiers of the English football league, with loess smoothers. (Click image to enlarge.)
As low-scoring matches are arguably less exciting than those with many goals, we now consider the proportion of low- and high-scoring matches. Various authors have worked on the statistical modelling of football goals.6, 7, 8 Figure 4 shows the proportion of English Football League matches with one or zero and with two or fewer goals, while Figure 5 presents the proportion of matches with four or more and with five or more goals. Because Figure 4 is based on low-scoring matches, higher proportions could be related to less excitement. Conversely, Figure 5 is based on high-scoring matches, and so higher proportions could correspond to more excitement. As before, we generally observe a decline in excitement, followed by a recovery between the wars, then further decline and some recovery. In recent times, around 10% of matches in all tiers produced five or more goals, down from higher values of over 20% earlier in the league’s history.
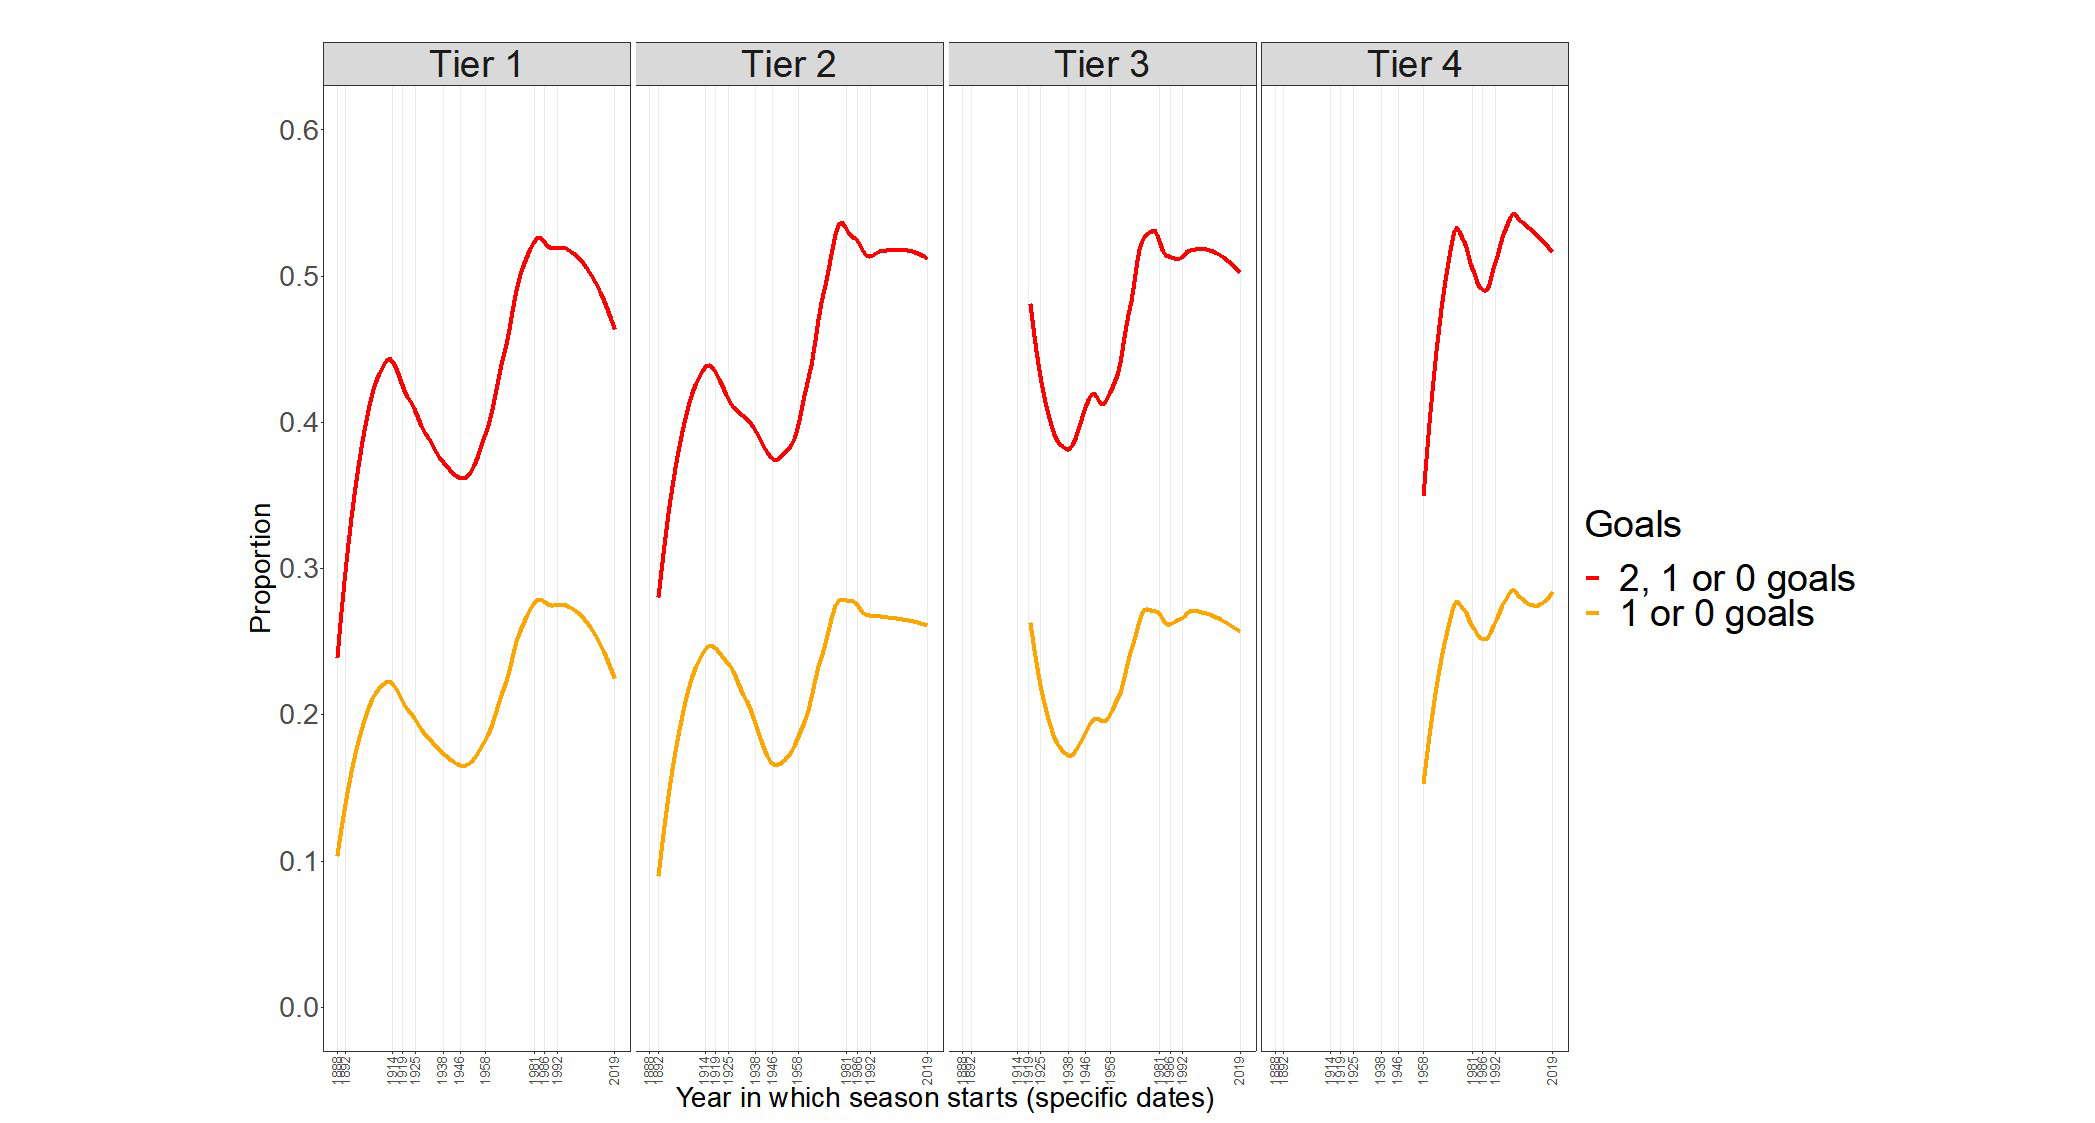
Figure 4: The proportion of matches in which there were one or zero goals, and two or fewer goals in all four tiers of the English Football League, shown by loess smoothers. (Click image to enlarge.)
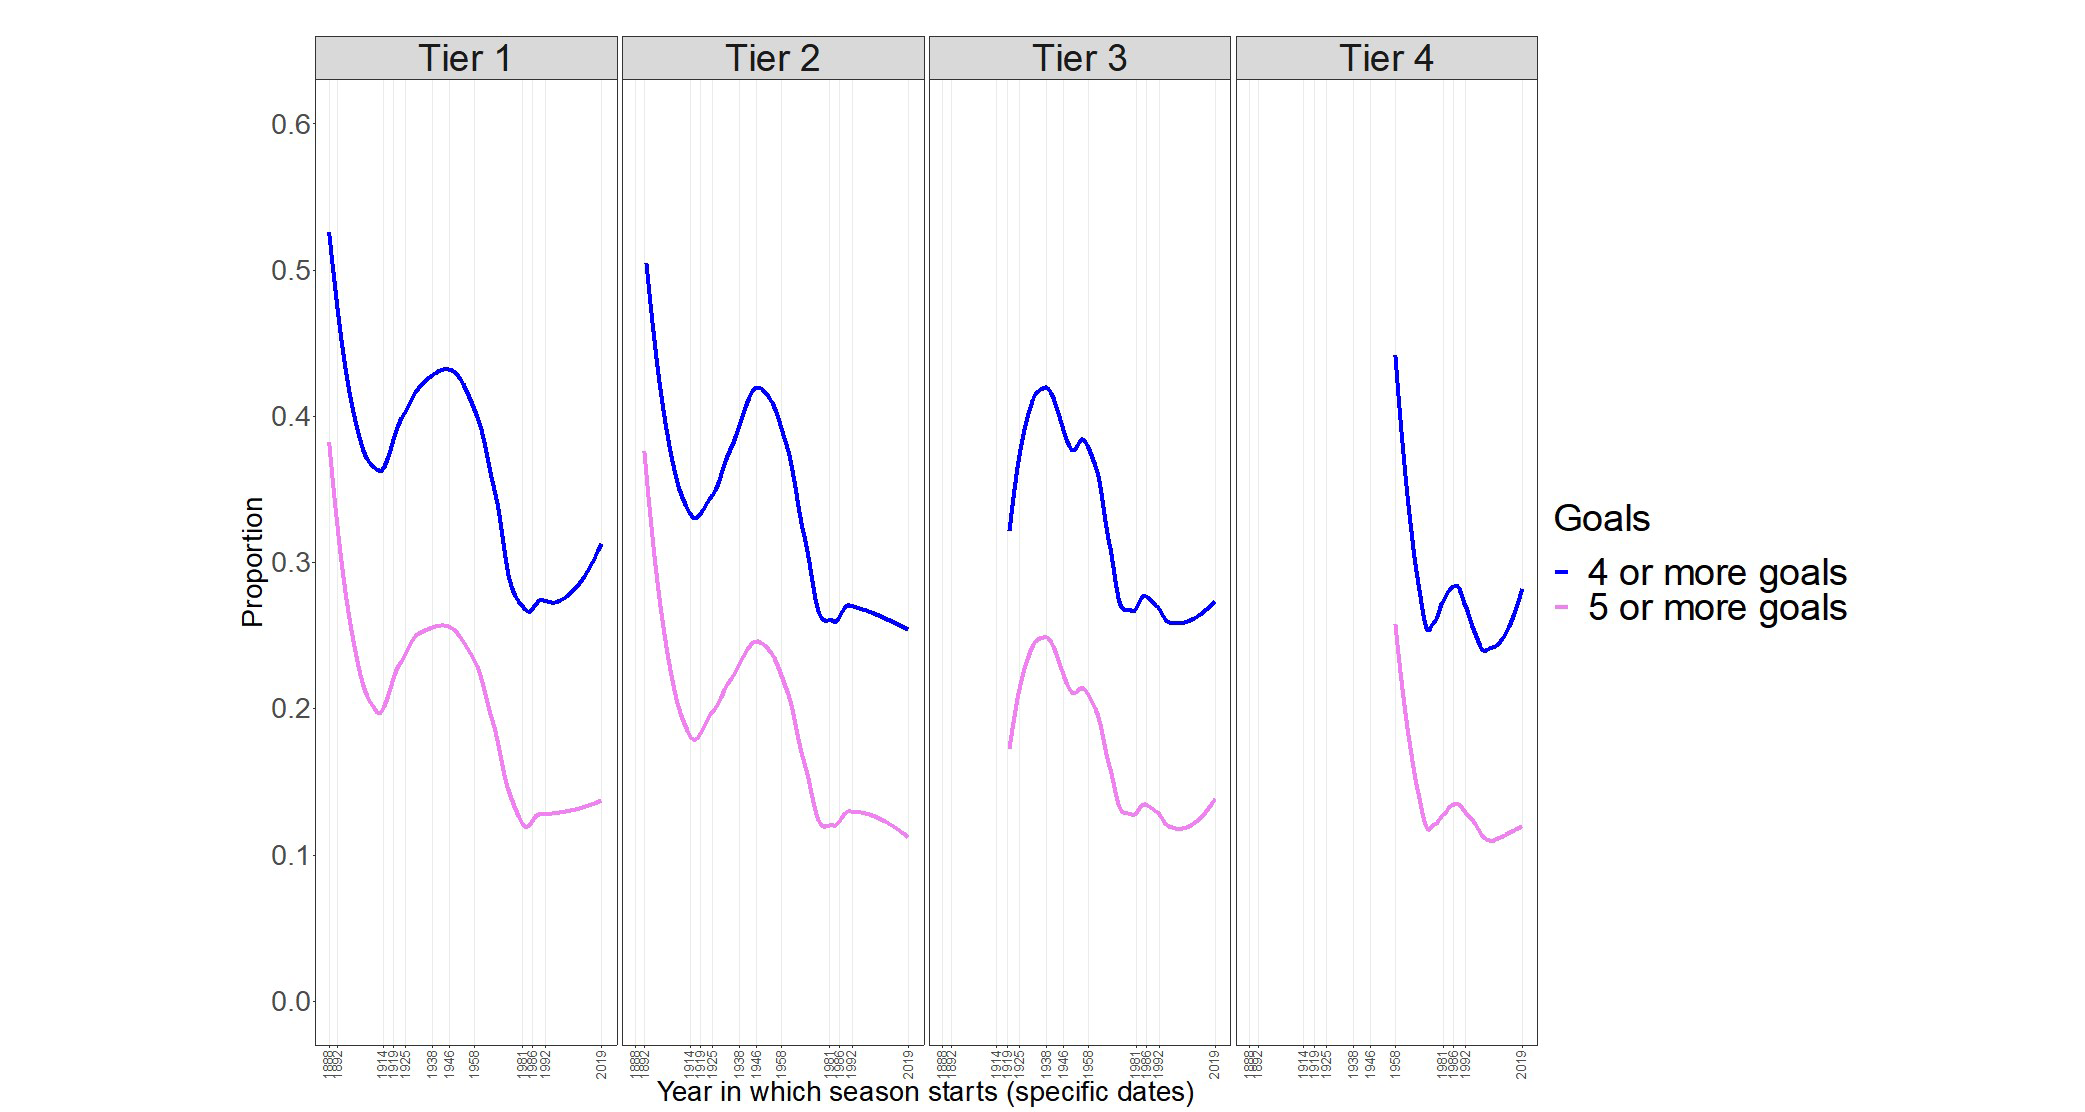
Figure 5: The proportion of matches in which there were four or more goals, and five or more goals in each tier of the English football league, shown by loess smoothers. (Click image to enlarge.)
Discussion
Based on the measures that we have explored, we would conclude that in general English league football has become less exciting over the years, although there have been recent stabilizations or improvements.
But what about individual teams? The excellent databases compiled by Curley, together with the data manipulation and visualization tools provided by the tidyverse mean that it is relatively straightforward to perform similar – and even more extensive – explorations for many favourite football clubs. The ease with which such visualizations can now be produced means that the outreach potential associated with football data is even greater. We finish with a specific example.
Example: Plymouth Argyle Football Club
Relatively simple R code can be used to replicate some of the above analyses for a favourite club. We illustrate this briefly for Plymouth Argyle Football Club (PAFC), with our code being available on GitHub. We chose PAFC because all authors have some interest in this club. Statso regularly contributes to the PAFC website (see here and here) and to match programmes.
PAFC is an English football club based in the city of Plymouth. In the 2020 season, PAFC compete in League One (tier 3), following promotion from League Two (tier 4) in 2019. Plymouth is the biggest city in Europe never to have had a football team in its country’s top-flight: PAFC has been a member of the English Football League continuously since 1920, spending 40 seasons in tier 2 (23 of which have been since 1958), 29 seasons (including 2020) in tier 3 (28 since 1958), and 13 in the regionalized tier 3 before 1958.
The left panel of Figure 6 presents the average number of goals per match in each season for PAFC. The decline since 1958, seen above for the English Football League, seems to have stabilized somewhat around the 1980s. There is also some possible recent improvement. The right panel of Figure 6 shows that the proportion of draws has been relatively stable across time, with perhaps some signs of improvement being indicated by the decline in draws towards the end of the period under study. PAFC has changed tier on several occasions during this period, and we are working on ways of taking this into account in the analysis.
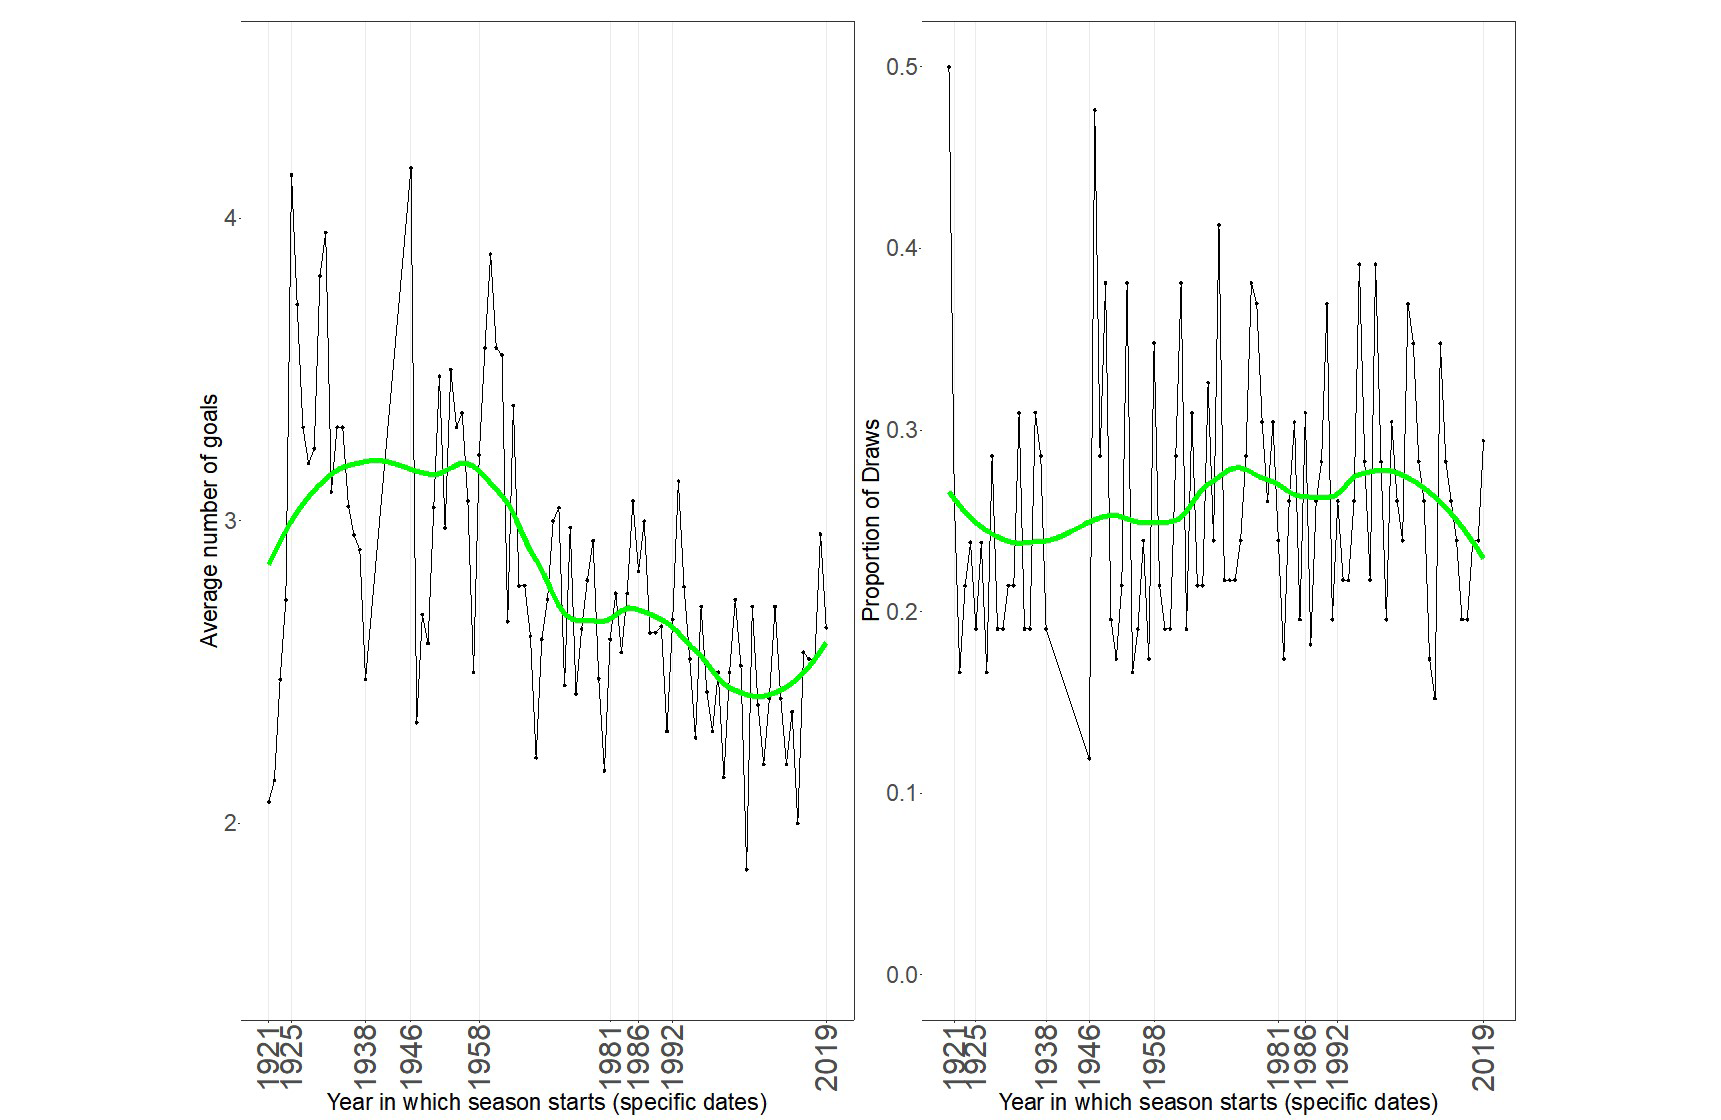
Figure 6: The average number of goals (left) and the proportion of drawn matches (right) in each season for PAFC. (Click image to enlarge.)
Figure 7 suggests that the proportion of low-scoring PAFC matches increased, while the proportion of high-scoring matches decreased after World War II. There is also some evidence for possible recent improvements in match excitement, as measured in this way.
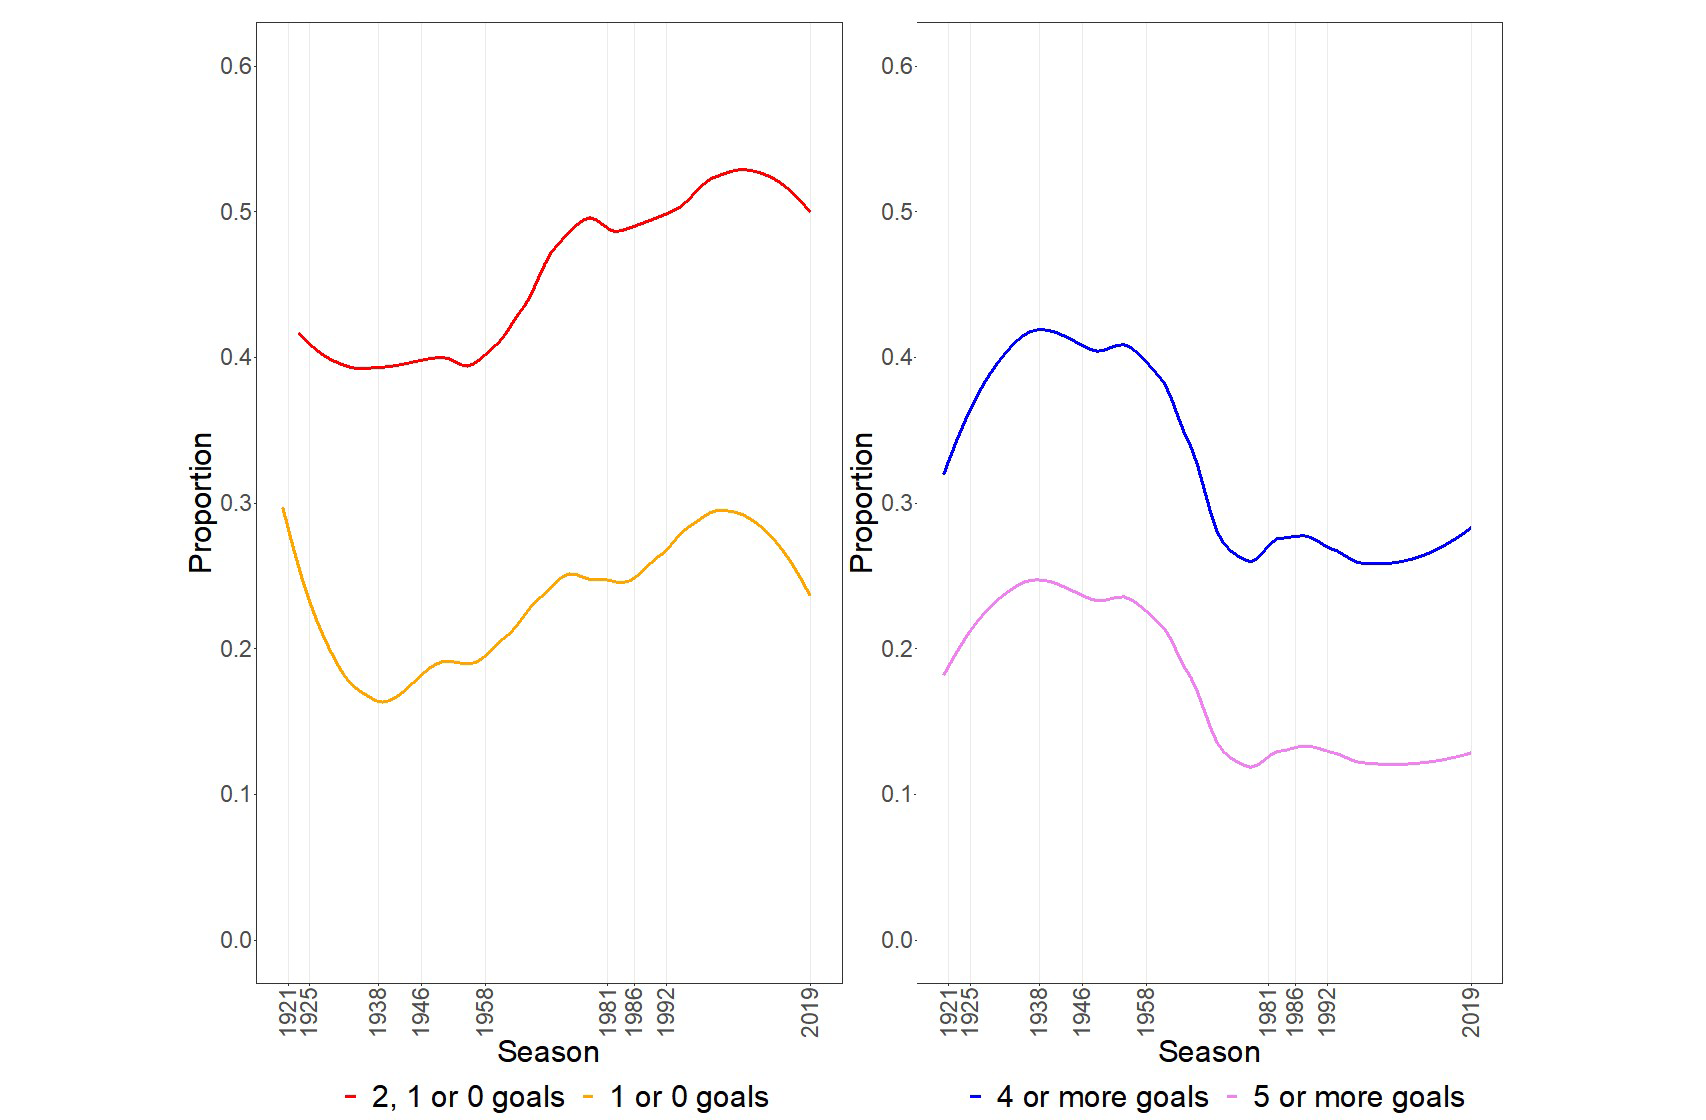
Figure 7: The proportion of low- (left) and high- scoring (right) matches for PAFC. (Click image to enlarge.)
Some data resources
In addition to the excellent and easy-to-use databases compiled by Curley, these resources can be used to follow many football clubs of interest:
- England – Football Statistics Archive – League Records provides league tables from the 1888–89 to the 2007–08 season.
- SOCCERWAY starts its coverage from the 1901–02 season.
The rvest R package can be used to obtain data from these sites.
Acknowledgements
We are very grateful to Brian Tarran for extensive suggestions that have considerably improved this article. We are also grateful to the then School of Mathematical Sciences, University of Bath, where the authors met as PhD students at the end of the 1980s.
About the authors
Statso, otherwise known as John Eales, is Deputy Head of the School of Engineering, Computing and Mathematics at the University of Plymouth. He has research interests in statistical education and regularly contributes statistical articles to Plymouth Argyle publications.
Julian Stander is associate professor in mathematics and statistics, Centre for Mathematical Sciences, University of Plymouth. He has applied Bayesian statistical methodology to a range of application areas and is also interested in statistical education.
Mario Cortina Borja is chairman of the Significance editorial board, and professor of biostatistics in the Population Policy and Practice Teaching and Research Department, at the Great Ormond Street Institute of Child Health, University College London. He has worked in many scientific areas as an applied statistician.
References
- Wilson, J. (2009) The Question: Is three points for a win good for football? The Guardian, 5 February 2009. https://www.theguardian.com/sport/blog/2009/feb/05/question-jonathan-wilson-three-points
- Hon, L. Y. and Parinduri, R. A. (2016) Does the three-point rule make soccer more exciting? Evidence from a regression discontinuity design. Journal of Sports Economics, 17, 277-395.
- Ghilagaber, G. and Munezero, P. (2020) Bayesian change-point modelling of the effects of 3-points-for-a-win rule in football. Journal of Applied Statistics, 47(2), 248–264.
- Eichenseer, K., Balthasar, U., Smart, C., Stander, J., Haaga, K. and Kiessling, W. (2019) Jurassic shift from abiotic to biotic control on marine ecological success. Nature Geoscience, 12, 638–642.
- Lunn, D., Jackson, C. Best, N., Thomas, A. and Spiegelhalter, D. (2012) The BUGS Book – A Practical Introduction to Bayesian Analysis. CRC Press / Chapman and Hall.
- Reep, C., Pollard, R. and Benjamin, B. (1971) Skill and Chance in Ball Games. Journal of the Royal Statistical Society Series A, 134, 623–629.
- Pollard, R. (1985) Goal-Scoring and the negative binomial distribution. The Mathematical Gazette, 69, 45–47.
- Greenhough, J., Birch, P.C., Chapman, S. C. and Rowlands, G. (2002) Football goal distributions and extremal statistics. Physica A, 316, 615–624.


