
In the 2010 Census, young children had a higher net undercount than any other age group (see Figure 1). The net undercount rate for age 0 to 4 was 4.6 percent and the rate for age 5 to 9 was 2.2 percent. No other age group had as large an undercount and most adult age groups had an overcount.

Figure 1. Net undercount/overcount rates (percent) in 2010 Census by age. Source: US Census Bureau May 2012 Demographic Analysis release.
Families in some locations seemed to be more forgetful than others. State-level estimated coverage rates for children aged 0 to 4 ranged from a 10 percent net undercount in Arizona to a 2 percent overcount in North Dakota.1 For the population aged 0 to 4, the mean difference between the census counts and the expected figures for the 10 largest counties in the US was 11 percent. These geographic differences are important because the census data are used to distribute more than $400 billion a year to states and localities.
Undercounts in the census have a ripple effect throughout the US federal statistical system. Census figures, and subsequent population estimates based on the census, are used to weight nearly every survey taken by the government. Census population estimates are widely used in the private sector as well. If a group is undercounted in the census, they will be underestimated in surveys for a decade. Census counts and population estimates are also used as denominators in constructing many rates, so undercounts skew those rates as well.
Moreover, the net undercount of young children has been getting worse. In the 1980 US Census, the net undercount rate for young children was 1.4 percent but it has more than tripled since then. At the same time, the census coverage rate for adults has continued to improve (see Figure 2).

Figure 2. Percent difference between census counts and demographic analysis estimates for adults and young children: 1950 to 2010. Source: US Census Bureau, 2010 Census and 2010 Demographic Analysis, May 2012 release.
The undercount of young children is puzzling and many people are surprised to learn that young children have a higher net undercount rate than any other age group. It is counterintuitive for many people. In the words of former US Census Bureau Director Robert Groves: “It’s often a surprise to many people when they learn that children tend to be undercounted in the US Censuses. Most can imagine various types of adults who fail to participate in Censuses, but don’t immediately think of children being missed.”2
How does the Census Bureau know who is missed in the census?
The method that is widely acknowledged to be the best method for assessing census coverage of young children is called Demographic Analysis (DA). In the DA method the Census Bureau creates a separate independent estimate of the expected population based largely on birth and death records which is compared to the census counts. The biggest uncertainty in the DA estimates is international migration, but for young children this is a minor factor (as documented in the first paragraph of this article). It should be noted that many other countries that use a variety of methods to assess census coverage also find high net undercounts of young children.
The high net undercount of young children is also inconsistent with much of the survey methodology literature which shows households with children are generally more likely to respond to a survey than households without children.3,4 Groves and Couper (1998, page 138) offer this succinct summary of the relationship between children in the household and cooperation in survey research: “Without exception, every study that has examined response or cooperation finds positive effects of the presence of children in the household.” Of course, it is possible that households with young children respond at a high rate, but fail to include the young children in the returned questionnaire.
It may be that the undercount of young children in the US Decennial Census evaluation is just the tip of the iceberg. In the US Census Bureau’s American Community Survey, Current Population Survey and Survey of Income and Program Participation, children aged 0 to 4 have lower coverage rates than older children or adults.5 Also, examination of more than a dozen censuses in other countries shows that (a) nearly every census examined had a net undercount of young children, (b) the net undercount for young children is generally higher than that for older children, and (c) it is usually higher than that for adults.6
This evidence suggests that the under-reporting of young children in data collection efforts may be widespread, but it has not yet been widely recognized. If this issue were to be examined in other censuses and surveys, I feel confident that many would find an undercount or under-reporting of young children.
Census coverage data from the 2010 US Census underlines the importance of treating young children differently than older children in assessing undercounts and overcounts. While the population aged 0 to 4 had a significant net undercount, the population age 14 to 17 had an overcount. Treating the population under age 18 as an homogenous population with respect to census coverage is likely to mask real differences by age. Data in Figure 3 also make it clear that the net undercount rates for children in different age groups are diverging over time.
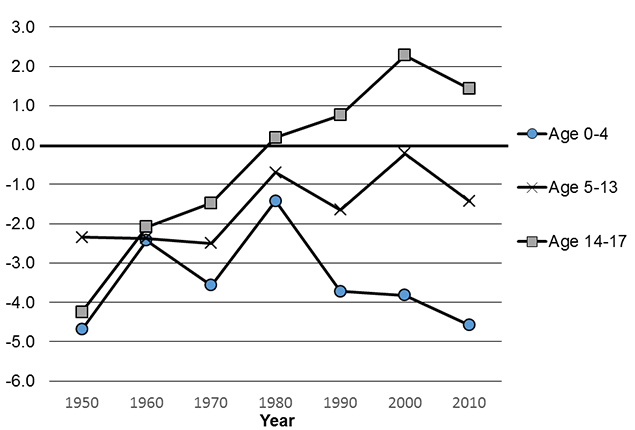
Figure 3. Net undercount/overcount rates (percent) for different age groups of children: 1950 to 2010. Source: O'Hare 2014.
Potential explanations for the high net undercount rate of young children
It is clear that many young children were missed in the 2010 US Census, but it is not clear why they were missed. In the words of a 2014 report from an internal US Census Bureau task force on the undercount of young children: “The task force is convinced that there is no single cause for the undercount, so there will be no single solution. Planners should explore multiple avenues to be confident we can reduce the undercount of young children in 2020 from the levels found in 2010."
It is important to recognize that ideas about why young children have a high net undercount must not just explain why young children are missed, but why they are missed at a much higher rate than other age groups, including older children.
Given the significant and growing nature of this problem, it is important for the field to begin developing ideas about why this phenomenon has occurred. Without a clear idea about what causes the high net undercount of young children in the census, it is unlikely that it can be corrected.
To date, there is no firm evidence on what portion of the net undercount of young children is due to those living in a household that was not included in the census ('unit nonresponse' in survey parlance) and what portion is due to young children being left off a census questionnaire that was returned ('item nonresponse' in survey parlance). This is an important question in terms of figuring out how to remedy the high net undercount of young children.
One potential explanation is that young children are a disproportionately high share of people living in the kinds of neighborhoods, families, and living arrangements where the population is difficult to enumerate. Some examples of this are shown in Table 1. Young Black and Hispanic children are particularly concentrated in hard-to-count households and communities.
| Percent of children aged 0 to 4 in this kind of situation | |||||
| Living situation | Percent of adults in this kind of situation | Percent of children aged 5 to 17 in this kind of situation | Total | Black | Hispanic |
| Population living in something other than husband/wife household | 41 | 34 | 34 | 67 | 40 |
| Population living in rental unit | 30 | 35 | 45 | 70 | 60 |
| Population living below the poverty level | 16 | 21 | 26 | 46 | 36 |
| Population who moved between 2009 and 2010* | 15 | 14 | 21 | 27 | 23 |
| Population living in building with 10+ units | 10 | 6 | 9 | 16 | 15 |
| Population living in crowded households (more than one person per room) | 6 | 13 | 17 | 19 | 35 |
Table 1. Age distribution of selected characteristics thought to be associated with census undercounts. Source: Author's tabulation of 2010 ACS PUMS on the IPUMS system at the University of Minnesota. *Data for young children reflects ages 1 to 4.
To some extent we have been better at finding data to reject ideas than data to support ideas about why young children have a high net undercount.6,7 Theories that can probably be discounted include:
- The suggestion that young children are missed at a high rate in the US Census because a large share of young children live in immigrant families and immigrant families are often thought of as difficult to enumerate. However, young children are not any more concentrated in immigrant families than older children and older children have a net overcount.
- The suggestion that the high net undercount of young children is really due to a low overcounts rather than high undercounts. But there is no evidence that young children are overcounted at a low rate. The overcount rate for young children is nearly the same as that for older children.
- When the age of a person is not provided in the census questionnaire the Census Bureau must impute an age for that person and some people think that perhaps too few persons are imputed as age 0 to 4. But the number of people with imputed age is relatively small and there is no evidence that young children are under-imputed by the census algorithm that does the imputing of age.
Perhaps the most fundamental conclusion is that there is very little solid information in the literature regarding reasons for the high net undercount of young children. Clearly, more research is needed.
As we move toward the 2020 US Census, the US Census Bureau has recognized the high net undercount of young children as an important topic and is taking steps to address the issue. However, time is getting short to figure out why young children are missed in the census and develop remedies to fix the problem. By 2018, the 2020 Census questionnaire has to be finalized and final operational plans need to be tested in the 2018 dress rehearsal. To make matters worse, it appears that Congress is reluctant to give the Census Bureau the money it needs to test new methodologies that might help solve this problem.
- Dr William P. O'Hare is a senior fellow with the Annie E. Casey Foundation, an organisation that funds initiatives to help tackle economic, social and health problems affecting children. He is also president of O'Hare Data and Demographic Services.
References
- O’Hare, W.P. (2014). State-Level 2010 Census Coverage Rates for Young Children, Population Research and Policy Review, Volume 33, no. 6, pages 797-816.
- Groves, R., (2010). Children Count Too! Census Bureau’s Directors Blog March 9, US Census Bureau, Washington, DC.
- Groves, R. M. and Couper, M.P., (1998). Nonresponse in Household Interview Surveys, John Wiley and Sons.
- Brick, J.M and Williams, D., (2012). “Explaining Rising Nonresponse Rates in Cross-Sectional Surveys,” The Annals of the American Academy of Political and Social Science.
- O’Hare, W.P., Jensen, E., and O’Hare, B.C., (2013). Assessing the Undercount of Young Children in the US Decennial Census: Implications for Survey Research and Potential Explanations. Paper presented at the 2013 American Association of Public Opinion Researchers Annual Conference, Boston, MA.
- O’Hare, W.P. (2015). The Undercount of Young Children in the US Decennial Census, Springer Press.
- Griffin, D.H., (2014). Final Task Force Report: Task Force on the Undercount of Young Children, Memorandum for Frank A. Vitrano, US Census Bureau, Washington, DC. February 2.


