
Governments are now calling for disaster impacts to be included in the SDGs. As well as disaster reduction being an important standalone aim, catastrophes can also lead to major setbacks in development and a failure to achieve other major goals, like poverty reduction. Although not legally binding, these goals can have a major influence on how nations set their laws and how resources are allocated.
In the final draft, one of the targets is:
‘11.5 By 2030, significantly reduce the number of deaths and the number of people affected and substantially decrease the direct economic losses relative to global gross domestic product caused by disasters, including water-related disasters, with a focus on protecting the poor and people in vulnerable situations’
A key stumbling block is that all targets must have measurable indicators. For governments to manage their progress, they need to be able to measure their performance.
So how do you measure disaster risk?
The most obvious way to measure the progress of a country’s disaster risk reduction would be to observe the number of deaths and economic costs that result from disasters.
However, the underlying distribution of disaster impacts tends to be highly skewed, with the average dominated by infrequent high magnitude events. Therefore an indicator that is based purely on observed deaths or losses over a few years would give a misleading impression of success or failure.
If countries or regions are either lucky in avoiding (or unlucky in experiencing) severe disasters during the period measured, this could misrepresent the risk. A few years or even decades of catastrophe experience do not give a clear indication of the level of risk in a country or region. The 2010 Haiti earthquake claimed more than 200,000 lives and cost more than $13 billion. Yet for more than 100 years prior to this devastating event, earthquakes in Haiti had claimed fewer than 10 lives.
Haiti shows that it's simply not possible to determine the true level of risk from five or even fifteen years of observations for a single country. Even looking at worldwide data, a small number of high mortality events dominate the average disaster mortality data, and progress cannot be measured. For example, is the 1990 to 2000 period a better true average than the 2000 to 2010 period?
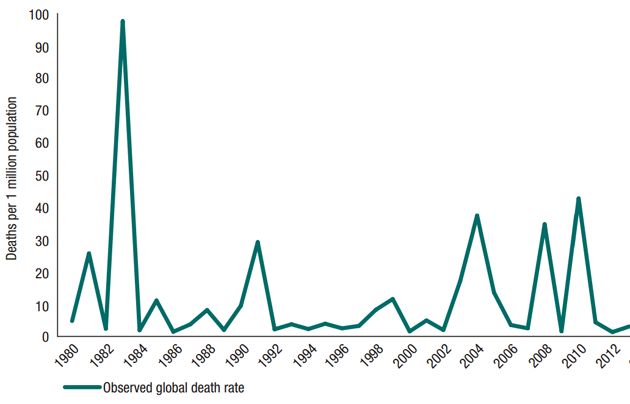
Global disaster related mortality rate (per million global population), 1980–2013 (From setting, measuring and monitoring targets for disaster risk reduction: recommendations for post-2015 international policy frameworks. Source: adapted from www.emdat.be)
However, the whole distribution of disaster events is critical to understanding the level of readiness and should be considered.
In the 1990s, the insurance industry learned a lesson about using a few decades of historical data to measure average levels of risk. In 1992, Hurricane Andrew hit the US as a category five storm, and at the time, was the costliest storm ever recorded. Nothing like it had been experienced before: 90% of homes had shattered roofs and 117,000 houses were classed as ‘destroyed’. Initial insured loss estimates were $3-4 billon and the final toll came in at $16 billion. As a result, nine insurance companies went bankrupt. It was clear to the insurance world that they could not manage their risk based on past experience alone. They had to take another approach.
Using probabilistic methods
Following the devastating catastrophes of the early 1990s, insurers turned to probabilistic catastrophe models, which simulate a synthetic history of tens of thousands of years of potential catastrophe events. Today, all global reinsurers writing business exposed to catastrophes employ probabilistic models based on these simulated histories.
A range of statistical techniques are used to incorporate known data into the model. For example, data from the available historical record or details of the levels of damage reported to a range of property types are used to develop more generalised relationships within the catastrophe model modules:
- Hazard: The characteristics and likelihood of the catastrophe. For example, the strength of ground shaking or flood depth expected at each location at a given annual probability or return period (such as 1% annual probability).
- Exposure: Known data on the location and characteristics of economic exposure (buildings, contents, crops, infrastructure and economic activity at risk of interruption) or human exposure (number and demographic of people) at a point in time.
- Vulnerability: The degree of damage, or other forms of loss, as a result of the impact of the hazard. For example, vulnerability functions can convert a peak gust wind speed of 40m/s into an average damage of 15% of the property’s value for a given type of building. Based on relating the mortality rates of the occupants of different building categories, and assessing where people are expected to be situated at different times of day, it becomes possible to link earthquake damage rates to the expected number of deaths and injuries.
How are these techniques relevant for governments?
Catastrophe risk modeling approaches are starting to be used by governments to measure their disaster risk, and to monitor how the risk shifts over time as the exposure of the built environment and vulnerability changes. This measurement can be carried out probabilistically using a full range of potential scenarios, each weighted for their probability, making it possible to generate an ‘average annual loss’ or a return period loss metric, such as the 1% (or ‘1 in 100 year’) loss.
Alternatively, the measurement can rely on a particular scenario with a calculated likelihood, as has been announced in Tokyo, with its plan to halve expected earthquake casualties over the next ten years. The city will model the performance of building stock in terms of collapse rates, fire starts and fire spread, which could result from a magnitude 7.3 earthquake under the city. There is a 70% likelihood such a quake will strike beneath the capital within 30 years. The key word here is expected. Tokyo will assess its progress against the casualty reduction goals without any lives being lost.
Metrics from models can also be used in other contexts, such as in understanding the costs and benefits of mitigation measures. Examples include measuring the average annual savings of a flood defense or earthquake early warning system. Or at a location level, choosing which building has the biggest risk reduction in terms of loss of life if retrofitted. It is also possible to estimate the impact of climate change, along with its uncertainties, and how these costs are expected to vary over time. As was carried out by RMS for exploring the future risks of hurricane wind and storm surge impacts for the United States in the 2014 Risky Business Study.
What about the availability of models?
In addition to countries where there is a developed insurance market, modeling is expanding to many middle income countries. Initiatives like the Global Earthquake Model and the global suite of catastrophe models developed by the UNISDR reflect the way a universal coverage of modeling is becoming available. As highlighted by the work in Tokyo, a single relevant scenario can also be employed for measuring progress, without the need to develop a fully probabilistic capability.
While not all the models are currently available for monitoring the target, we know what is required and how the relevant data can be collected and generated. Strong numerical targets and corresponding indicators could incentivise the spread the technology and expertise that has served the insurance industry so well over the past twenty years.
What’s next for the Sustainable Development Goals?
The final targets will be agreed by the UN in September and the indicator process is ongoing until next year. So is it possible to measure disaster risk and include it in the Sustainable Development Goals? Yes.
What target would I recommend? Starting in cities, a 50% reduction in the expected deaths and 20% reduction in expected economic losses (also recommended in the report published last year by the ODI, RMS and CRED).
Most importantly, how could a target citing disasters be measured with indicators? By modelling the expected number of deaths, expected number of affected people and expected direct economic losses (relative to GDP.) These should be based on exposure, hazard and vulnerability, as demonstrated by Tokyo, without the need for disasters to take place.
A strong set of meaningful indicators are required to incentivise critical risk reduction activities that reduces lives being lost. We know that indicators based on disaster occurrences over a ten or fifteen year period are not meaningful. Now it’s up to the government statisticians to decide.


