The results of these polls were broadly consistent throughout the campaign. But they were so different from the actual result for the two largest parties that the British Polling Council has launched an independent enquiry into the causes of the error.
So how different were the polls from the actual result? The chart below shows seven point moving averages of the share of the vote for each party as estimated in opinion polls carried out by several major polling companies during the campaign period (from March 30 2015), with the result of the 2015 general election marked at the end of each series with a party coloured x.
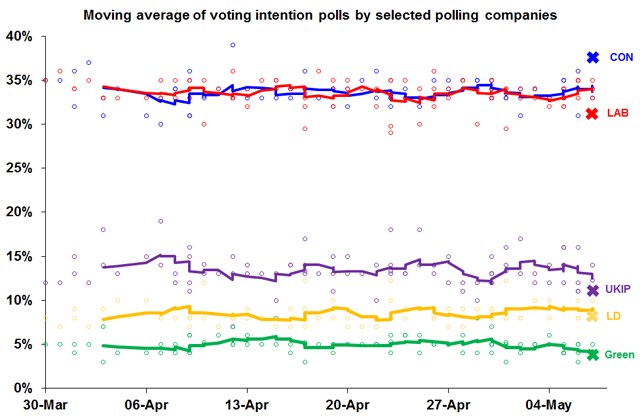
The chart shows the result of all voting intention opinion polls carried out in Great Britain by YouGov, Populus, Survation, Opinium, TNS, ComRes, SportingIndex and ICM from March 30 to polling day on May 7. The series are smoothed with 7 point moving averages. The shares of the vote won by each party at the General Election within Great Britain are marked with an X1.
Throughout the campaign period, just one opinion poll showed the Conservatives winning a share of the vote greater than or equal to the actual result they achieved (37.6%). This was completed by ICM on April 12 and it estimated a Conservative vote share of 39%. However, none of the polls conducted during the campaign period showed a Conservative lead over Labour as large as they achieved (6.5%).
A closer consideration of the final polls
Comparing the final opinion polls, as reported by the British Polling Council, with the final general election result gives the following differences.
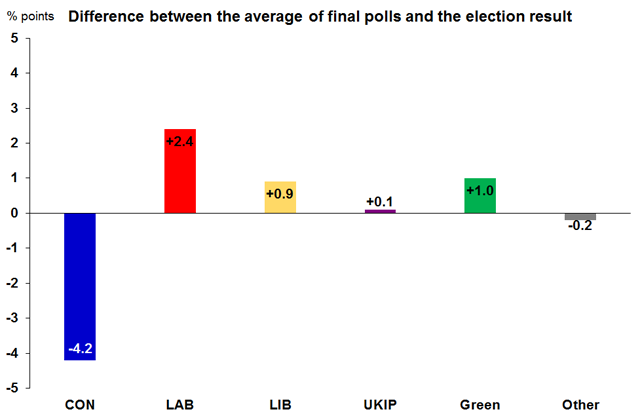
This chart shows the difference between the share of the vote suggested by the average of final voting intention opinion polls (carried out by selected polling companies) and the 2015 general election result, as reported by the British Polling Council2.
The difference between the share of the vote estimated by opinion polls, and the actual share of the vote received by any party was largest for the Conservatives. Final pre-election opinion polls suggested a Conservative share of the vote 4.2% smaller than that which they went on to achieve. Final pre-election opinion polls most accurately predicted the result for the UK Independence Party: on average they were only 0.1% higher than UKIP’s actual May 7 result.
How does this compare with other general elections?
The next chart shows how final voting intention polls carried out by IpsosMORI over the past 23 years have compared with subsequent polling day results. IpsosMORI is shown here because it is a major polling company with a long historic record of estimating voting intention at general elections. The chart shows the difference between the percentage share of the vote for each party in the IpsosMORI poll closest to each general election and result of that election.
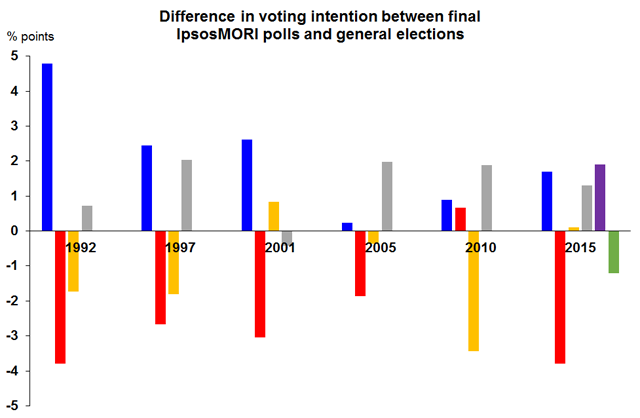
The number of days between the final IpsosMORI opinion poll and polling day varied from year-to-year3.
The difference between the final opinion poll and the result has varied for each party.
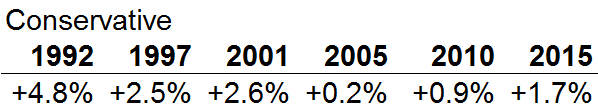
Since 1992 the Conservative Party won a higher share of the vote at each general election than the final poll suggested. This was most notable in 1992, when their share of the vote at the election was 4.8% larger than in the final poll.
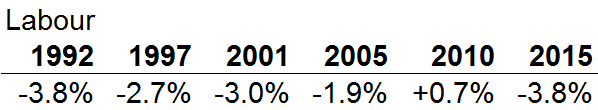
With the exception of 2010, Labour won a smaller share of the vote than the final poll estimated at each general election since 1992. The final opinion polls with largest differences from the election result were those of the 1992 and 2015 general elections, which estimated Labour’s share of the vote was 3.8% larger than achieved at the election.
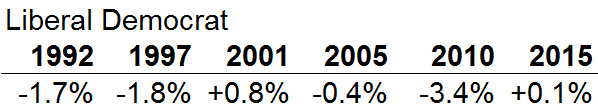
Most recently, the Liberal Democrat share of the vote was 0.1% larger than suggested by the final poll. The largest deviation a Liberal Democrat share of the vote had from a final poll occurred in 2010 when their share of the vote at the election was 3.4% smaller than the final poll estimated.
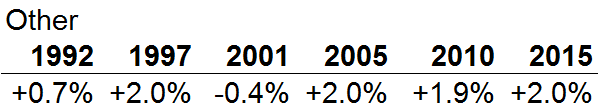
The ‘Other parties’ category accounts for the share of the votes received by all except the Conservative, Labour, and Liberal Democrat parties. Most recently, the share of the vote achieved by other parties was 2.0% higher than the final IpsosMORI poll suggested.
As the above analysis shows, polling companies have often had a particular difficulty accurately estimating the share of the vote for the Conservatives and Labour. And this bias was particularly pronounced in 2015. The day after polling day the British Polling Council announced an industry wide investigation into the causes of this error:
‘The final opinion polls before the election were clearly not as accurate as we would like, and the fact that all the pollsters underestimated the Conservative lead over Labour suggests that the methods that were used should be subject to careful, independent investigation.
The British Polling Council, supported by the Market Research Society, is therefore setting up an independent enquiry to look into the possible causes of this apparent bias, and to make recommendations for future polling.’
This article first appeared on the the House of Commons Library blog. The British Polling Council and the Market Research Society inquiry into the pre-election polls are holding an open meeting at the Royal Statistical Society in London on June 19 to discuss its terms of reference and timetable.
Footnotes
- 1. Sources: May 2015, Electoral Calculus, House of Commons Library: General Election 2015.
- 2. Sources: British Polling Council, House of Commons Library: General Election 2015.
- 3. Sources: British Polling Council, House of Commons Library: General Election 2015, House of Commons Library: UK Election Statistics


