If you feel less than sanguine about it and do a bit of the research to assuage your doubts, be prepared to feel even less confident afterwards. After years of casual research, the results I found have led me to file a lawsuit requesting access to the records needed to perform an audit myself.
My statistical analysis shows patterns indicative of vote manipulation in machines. The manipulation is relatively small, compared with the inherent variability of election results, but it is consistent. These results form a pattern that goes across the nation and back a number of election cycles. I’ve downloaded data and verified the results from several states for myself. Furthermore, the manipulation is not limited to a single powerful operator. My assessment is that the data reveals multiple (at least two) agents working independently to successfully alter voting results.
What convinced me that vote fraud is possible?
| Editor’s note Writing in our February 2017 issue, political scientist Mark Lindeman makes a strong case for why cumulative vote tally graphs – like those used in this article – are not appropriate “fraud detectors”. You can read Lindeman’s argument here. For the record, Significance is a magazine and not a peer-reviewed academic journal. Significance does not in any way endorse Clarkson’s analysis, nor share in its interpretations. Brian Tarran |
For me, it started with the 2004 Ohio presidential election. In 2005 I obtained and examined that data and it confirmed what other statisticians had said – that the results were highly suspicious. The official report from the congressional hearing on that election describes it as ‘the abuse and manipulation of electronic voting machines and the arbitrary and illegal behavior of a number of elected and election officials which effectively disenfranchised tens of thousands of voters in order to change the outcome of an election.’
For a thorough assessment, I recommend reading ‘Post-Election Audits: Restoring Trust in Elections‘ published by the Brennan Center for Justice which includes a lengthy appendix of various well documented voting equipment problems. The audit in my county (Sedgwick, Kansas) that I wish to perform is similar to those recommended in this report. Currently, my county does not perform any sort of post-election verification of voting machine results, not even for recounts. I know because I requested such a recount after the November 2014 election. That request was denied.
The voting machine software used is proprietary and even the election officials are not allowed to inspect it. This is termed Black Box Voting and combined with Direct Recording Electronic (DRE) voting, which permits touchscreen machines and does not require a paper trail allows a situation ripe for exploitation. In addition, as Harper’s Magazine reported in 2012, the security of these machines is so lax that:
‘As recently as September 2011, a team at the U.S. Department of Energy’s Argonne National Laboratory hacked into one of Diebold’s old Accuvote touchscreen systems. Their report asserted that anyone with $26 in parts and an eighth-grade science education would be able to manipulate the outcome of an election….Johnston’s group also breached a system made by another industry giant, Sequoia, using the same “man in the middle” hack – a tiny wireless component that is inserted between the display screen and the main circuit board – which requires no knowledge of the actual voting software.’
Also, there’s the fact that the polls are red-shifted (where there is systematic biasing toward Republican candidates) and have been for several election cycles. This is routinely assumed to be due to Republicans being less likely to answer pollsters, but there is no empirical justification for it. It’s used by polling organizations in their models in order to more accurately predict official results.
What convinced me to take action was a paper titled ‘Primary Election Results Amazing Statistical Anomalies’ by Francois Choquette and James Johnson. After analyzing the same elections (which I downloaded myself from various state government sites) and confirming Choquette and Johnson’s results, I had to try and do something about the problem. The data I’ve analyzed supports their hypothesis that we have a serious pervasive and systematic problem with electronic voting machines.
The results of my analysis
Here are the results for three different elections, all occurring after the Choquette and Johnson paper was published, all three conform to their predictions: the 2012 Ohio presidential race, the 2014 Wisconsin gubernatorial race and the 2014 Kansas Senate elections.
If there is no significant interaction between voting precinct size and %Republican (%R) vote (our null hypothesis), then we expect no significant slope to the ratio of the cumulative sums of Republican votes to total votes cast for sufficiently large n. While there will be considerable variation in the initial terms of the summation, as n grows large, the ratio will converge to the true proportion p, which I express as a percent1.
Put another way, if the variation is randomly distributed across all precinct sizes, then the law of large numbers ensures that the sample proportion will quickly approach the true proportion. However, if there is a relationship where the larger precincts have a larger %R votes, this will show up as a positive slope in the cumulative ratios of the two sums. If the inverse relationship holds, we will see a negative slope in the cumulative ratios.
This formulation could be extended to multiple races. Elections in non-overlapping jurisdictions would be independent under the null, while multiple races with overlapping jurisdictions would need more careful computation.
In this model, %R will converge quickly to p if the variable on the x-axis is randomly distributed. If it does not converge for a given sequence (such as precinct size), that indicates that you have located a signal amidst even a large amount of noise. Graphing the cumulative percentage versus the cumulative votes ordered by precinct size allows a quick visual inspection to look for a suspicious trend.
The graph below shows the cumulative votes (x-axis) by %R (y-axis) model for three different races in three different states.
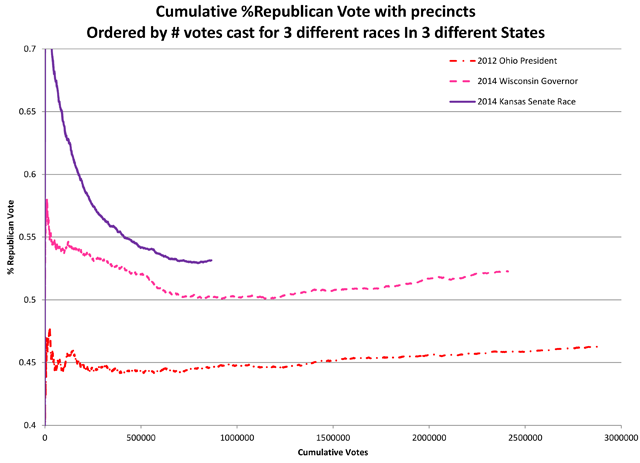
There is an expectation that %R vote will go down with the size of the precincts due to the association of rural districts with the %R vote. These trends are clear in the data. For the concern regarding voting machine manipulation, I restricted the visual inspection to the right half of the graph showing the larger precincts associated with higher density population centers. This truncation of the data eliminates the confounding effect of rural districts which are expected to have both a higher %R vote and smaller precincts in terms of number of votes cast.
In all three cases, there is an indication of an upward trend as we get to the largest precincts. The downward trend on the left of zero to approximately 600,000 to 800,000 cumulative votes is expected and appropriate.
The upward trend on the right is the pattern that concerns me. It shouldn’t be there at all. But such a pattern would be expected under the hypothesis of vote fraud proposed in the Choquette and Johnson paper.
Given that the signal exists, another approach to demonstrating this is by simple linear regression restricted to precincts with more than 500 votes cast. When separated out by machine type, the evidence for vote fraud by machine or software sabotage is compelling. My results for the three elections are broken out by machine type for the top five voting systems.
Wisconsin 2014 gubernatorial race results
Wisconsin has three voting systems which show a statistically significant positive linear relationship between the two variables.
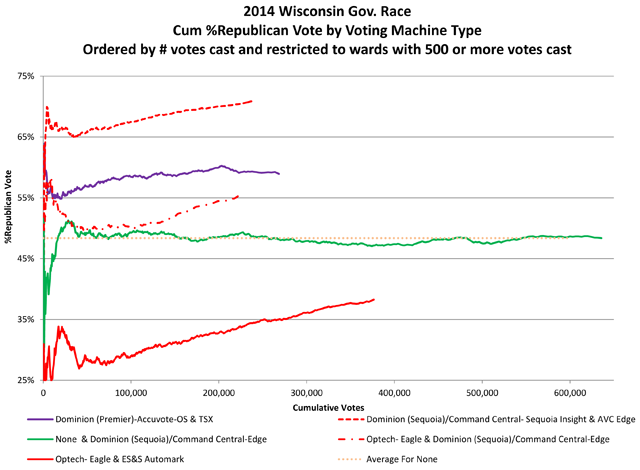
In this graph, look at the green line. It’s approximately what I expect when there is no effect attributable to the number of votes cast. The green line is the result of the precincts with ‘none’ listed as their primary voting machine equipment and either Dominion (Sequoia) or Command Central-Edge for the ADA voting. It does not have a statistically significant linear relationship between the number of votes cast and %R.
The voting systems represented by the three red lines all show a statistically significant effect for a linear regression analysis with votes cast being the independent variable and %R the dependent variable. These lines all demonstrate a clear upward trend on the right.
The purple line doesn’t show a similar trend and doesn’t have a statistically significant effect for a linear regression analysis.
Ohio 2012 presidential results
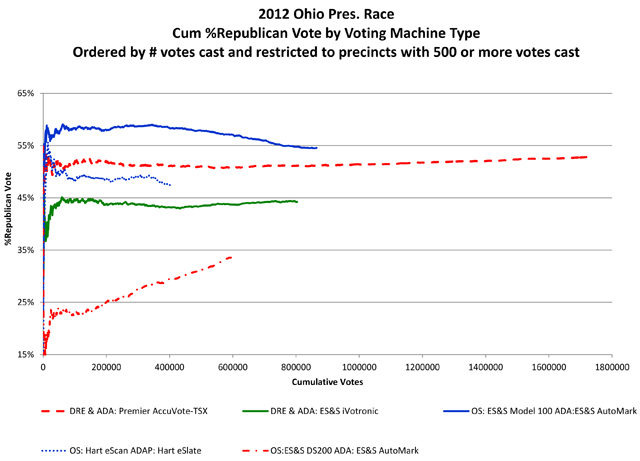
Four of the five voting systems shown have statistically significant linear trends. The voting system represented by the green line in the center is the only system in large scale use that does not confirm such a trend. The voting systems represented by the two red lines both show statistically significant linear positive linear relationships for %R with votes cast.
The voting systems represented by the two blue lines both show statistically significant linear negative linear relationships for %R with votes cast. The different systems show different patterns, which I interpret as representing different scales or types of manipulation.
In short, the evidence supports a theory of multiple (minimum two) independent parties affecting various voting systems to rig the election in their preferred direction. Ohio had a plethora of different systems in use, but none of the voting systems not shown had a statistically significant relationship.
Kansas 2014 Senate race
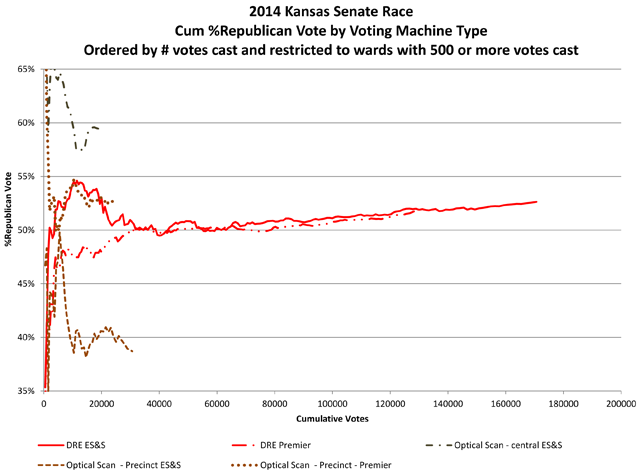
The two red lines show an upward trend on the graph and have a statistically significant linear relationship between the %R vote and the total votes cast. The three brown lines do not.
I want to emphasize, as I always try to do, that statistics don’t prove vote fraud. These statistics show that patterns exist in the data that correlate the type of electronic voting system in use with the %R vote changing with the total votes cast.
Such patterns are examples of what we might expect to see if some voting systems were being sabotaged, but that doesn’t mean that no other explanations are possible for these patterns. Voting machine manipulation is, in my opinion, the most likely explanation for these patterns. The most common pattern supports Republican candidates, but Democratic candidates are sometimes the beneficiary.
The only way to prove vote fraud is through a post-election audit demonstrating significant deviations from the reported totals. That is what I want to see done. It is also recommended by experts in voting integrity, including ‘The American Voting Experience: Report and Recommendations of the Presidential Commission on Election Administration’ published in 2014.
Footnotes
I encourage others to download election results datasets from the various state governments and check my results and check other elections to see if this pattern holds. If anyone does this, would you please contact me? I would appreciate knowing my errors if I have made any. If I agree with your finding, I will update my tables and graphs to the correct values. And if you concur with my analysis and would be willing to state this in writing, I could use that as support for my legal case requesting access to voting records.
1. \begin{array}{l}H_0\;:\;lim_{n\;\uparrow}\frac{\sum_{i=1\;}^nRV_i}{\sum_{i=1\;}^nTV_i}\rightarrow p\\\end{array}
\begin{array}{l}H_a\;:\;lim_{n\;\uparrow}\frac{\sum_{i=1\;}^nRV_i}{\sum_{i=1\;}^nTV_i}\rightarrow\pm\infty\\\end{array}
Where
RVi = the Republican Vote Count for Precinct i
TVi = the Total Vote Count for Precinct i
n = the number of precincts
p = the unknown true proportion of the Republican vote
2. The tables displaying the total votes for the voting systems in Ohio, Wisconsin and Kansas with a sufficient number of sufficiently large precincts along with the slope of the regression line(b1) and their respective p-values, can be found below.
Table 1: 2014 Wisconsin gubernatorial race results by voting machine type
| Code | Voting System | No. Wards | Sum Votes | Slope b1 | p-value for b1 |
| 1 | Dominion (Premier)-Accuvote-OS | 259 | 268468 | 1.17764E-07 | 0.220034878 |
| 2 | Dominion (Sequoia)/Command Central- Sequoia Insight & AVC Edge | 203 | 240142 | 4.92519E-05 | 6.72698E-09 |
| 5 | ES&S DS200 & Automark | 69 | 65257 | -3.41414E-05 | 0.336005978 |
| 6 | ES&S DS200 & ExpressVote | 40 | 49631 | 5.35097E-06 | 0.833096552 |
| 9 | ES&S M100 & Automark | 91 | 81579 | 4.83493E-06 | 0.838665696 |
| 13 | None & Dominion (Sequoia)/Command Central-Edge | 516 | 635835 | 1.09055E-06 | 0.924974015 |
| 18 | Optech- Eagle & Dominion (Sequoia)/Command Central-Edge | 197 | 225655 | 5.93071E-05 | 1.69045E-06 |
| 19 | Optech- Eagle & ES&S Automark | 408 | 376372 | 0.00014061 | 5.07873E-09 |
| Voting Systems with too few sufficiently large Wards for an individual analysis | 49 | 40977 | |||
| All WI Precincts with more than 500 votes cast | 1832 | 1983916 | 4.03177E-05 | 1.79811E-08 | |
Table 2: 2012 Ohio president race results by voting machine type
| Code | Voting System | No. Precincts | Sum Votes | Slope b1 | p-value for b1 |
| 1 | DRE & ADA: Premier AccuVote-TSX | 2416 | 1718395 | 0.000102639 | 8.44E-07 |
| 2 | DRE & ADA: ES&S iVotronic | 1075 | 803636 | 2.77862E-05 | 0.360351 |
| 3 | OS: ES&S Model 100 ADA:ES&S AutoMark | 1175 | 864669 | -0.000207214 | 2.31E-13 |
| 4 | OS: Premier Accuvote ADA:Premier AccuVote-TSX | 44 | 27370 | -9.92438E-05 | 0.563861 |
| 5 | OS: Hart eScan ADAP: Hart eSlate | 485 | 405483 | -0.000136833 | 0.014345 |
| 6 | OS:ES&S DS200 ADA: ES&S AutoMark | 876 | 594351 | 0.000610095 | 1.25E-31 |
| 7 | OS & ASA:Dominion Image Cast Evolution | 23 | 14317 | 1.7199E-05 | 0.876427 |
| All Ohio Precincts with more than 500 votes cast | 6094 | 4428221 | 6.06622E-05 | 3.91E-05 | |
Table 3: 2014 Kansas Senate race results by voting machine type
| Code | Voting System | No. Precincts | Sum Votes | Slope b1 |
| 1 | DRE ES&S | 199 | 170636 | 6.23047E-05 |
| 2 | DRE Premier | 192 | 128191 | 0.000158864 |
| 3 | Optical Scan – central ES&S | 25 | 19828 | -1.68265E-05 |
| 4 | Optical Scan – Precinct ES&S | 42 | 30633 | -0.000103739 |
| 5 | Optical Scan – Precinct – Premier | 50 | 30730 | 0.000142676 |
| 6 | Paper | 1 | 517 | |
| All Kansas Precincts with more than 500 votes cast | 509 | 380535 | 5.10737E-05 | |
Links to the election data:


