
Throughout summer 2023, much of the world, including Southern Europe, sweltered due to unusually high temperatures. The anticyclone Cerberus caused wildfires in the Greek islands of Rhodes and Corfu, and elsewhere. The temperature in central Rome hit 41.8C on Tuesday 18 July 2023, causing locals and tourists to cool off in fountains and a rise in emergency hospital admissions. Athens was even hotter, leading to midday closures of the Acropolis. UN secretary general, António Guterres, stated that “the era of global boiling has arrived”.
But is he right? How can we quantify this?
We wanted to use publicly available data and some simple statistical analyses to gain a little more understanding of how the climate may be changing.
We obtained daily maximum temperatures for Rome Ciampino for the period 1961–2022 from here and for 1 January to 31 July 2023 from here. Rome Ciampino is situated around 12 km south-southeast of central Rome, outside the ring road, and is the site of the city’s second airport.
Following a practice used by Istat (The Italian National Statistical Institute), we took 1961–1990 as a baseline period. We computed the average maximum temperature for all days across this period. These daily averages are shown in Figure 1, from which we see the seasonal effect.
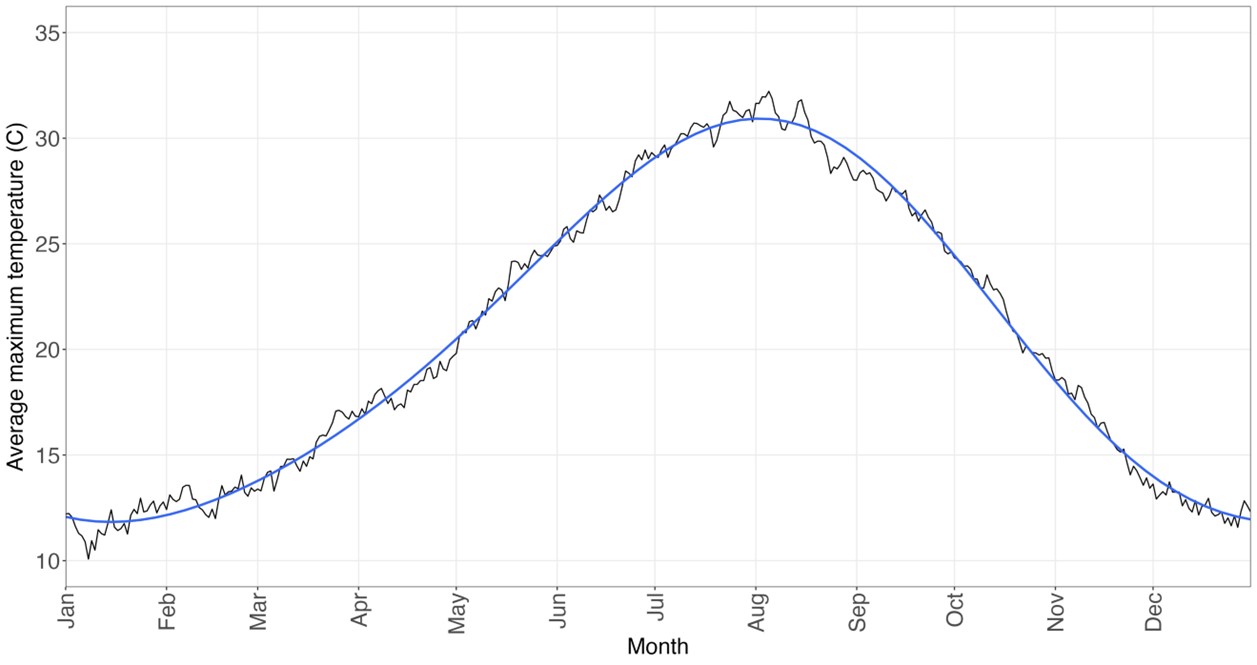
Figure 1: The average maximum temperature across all days in 1961–1990 for Rome Ciampino. A smooth curve based on trigonometric functions has been added.
We then subtracted these daily average baseline temperatures from the 1991–2023 data. For each day, we then averaged these relative maximum temperatures across the periods 1991–2000, 2001–2010 and 2011–2023, with the results being shown in Figure 2.
As expected, there is a lot of variation in the average relative maximum temperatures. We therefore added smooth curves based on trigonometric functions; loess curves were similar. From Figure 2, we see a considerable change across the periods. In 1991–2000, the average relative temperatures fluctuate closely around zero implying little difference from the 1961–1990 baseline. In 2001–2010, the average relative temperatures in the summer months are noticeably higher than the 1961–1990 baseline. This effect is even stronger in 2011–2023, as there are higher values across the year and not just in the summer.
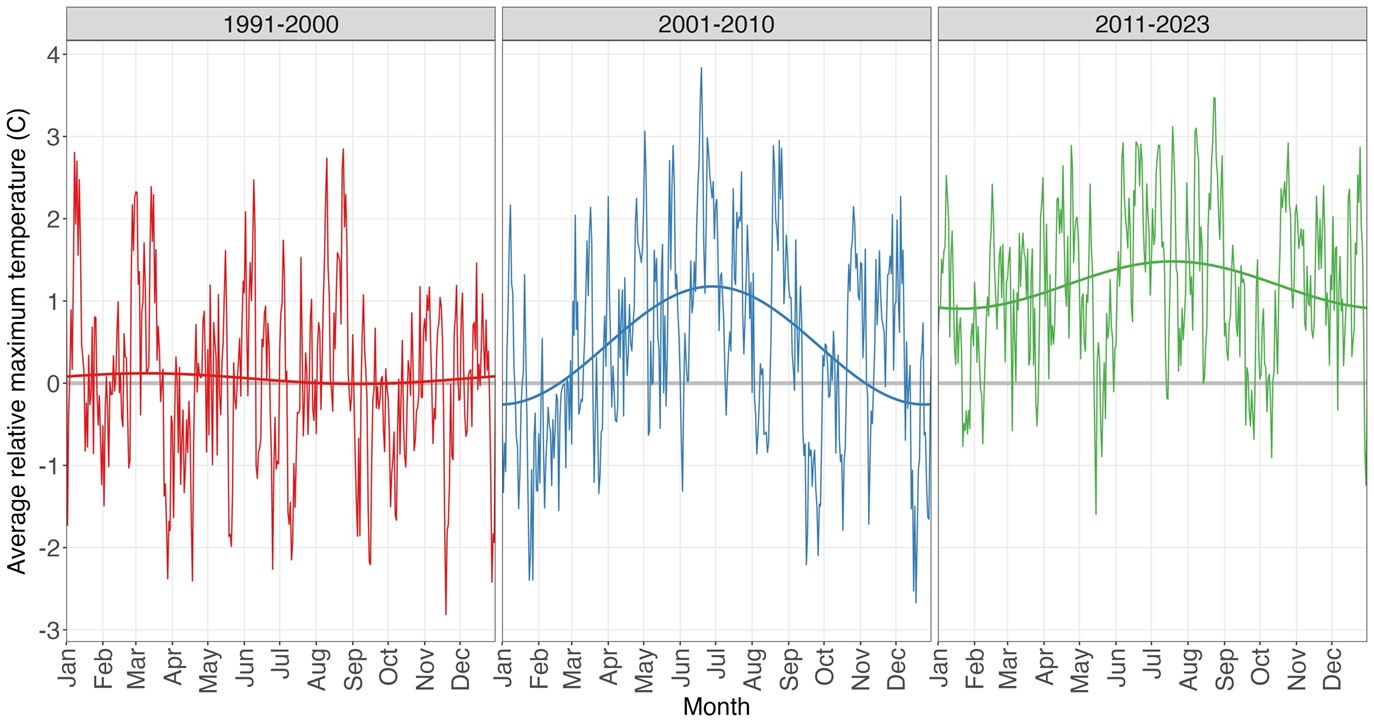
Figure 2: The daily average maximum temperatures relative to 1961–1990 across the periods 1991–2000, 2001–2010 and 2011–2023 for Rome Ciampino. A smooth curve based on trigonometric functions has been added. The grey horizontal line at zero corresponds to the 1961–1990 baseline.
In Table 1 we present the average daily maximum temperature across all July days in the periods 1961–1970, 1971–1980,…, 2011–2022 and 2023, together with the highest of these daily temperatures. There is a recent upward trend in the average and the 18th July 2023 highest temperature of 40.0C is the hottest so far seen for Rome Ciampino.
| Period | Average (C) | Highest (C) |
| 1961–1970 | 30.6 | 38.2 |
| 1971–1980 | 29.8 | 37.0 |
| 1981–1990 | 30.8 | 39.4 |
| 1991–2000 | 30.2 | 37.0 |
| 2001–2010 | 31.6 | 38.0 |
| 2011–2022 | 31.8 | 38.0 |
| 2023 | 33.0 | 40.0 |
Table 1: The average and highest daily maximum temperature across all July days in the periods 1961–1970, 1971–1980,…, 2011–2022 and 2023 for Rome Ciampino.
Although our study is limited to Rome Ciampino and daily maximum temperatures, we believe that the changes we have described are of concern. Whilst we make no claim that Rome is becoming “the infernal city”, we do believe that the strong warnings given by António Guterres and others should be taken very seriously.
Acknowledgements
We thank Luisa Franconi for very helpful discussions. We are also grateful to Mario Cortina Borja for encouraging comments and advice.
We used the tidyverse in R to perform computations and produce the graphs. The code and data are available upon request.
Julian Stander is associate professor in mathematics and statistics in the School of Engineering, Computing and Mathematics, University of Plymouth.


