
As a reader pointed out last week Nick Clegg's son is going to the London Oratory which is a state school and not as I had said a private school. The point I was trying to make still stands, however. Better-off parents want their children to go to schools such as the London Oratory because they feel that going to a good school will increase their chances of getting-on in life, including increasing the chances that they will go to a top university.
While it is understandable that parents try to do what they feel is best for their children, in doing so they reproduce social inequalities, such as the attainment gap between children from better-off and less well-off families.
My reason for discussing education and social mobility is not to disparage government attempts to increase levels of social mobility but to point out although most universities now have access agreements with the Office for Fair Access (OFFA), the effect of access agreements on levels of social mobility is likely to be fairly small. General government policies in areas such as childcare, welfare benefits and primary and secondary education will play a more significant part in determining whether able children from less well-off families do well at school and go on to university than access agreements between universities and OFFA.
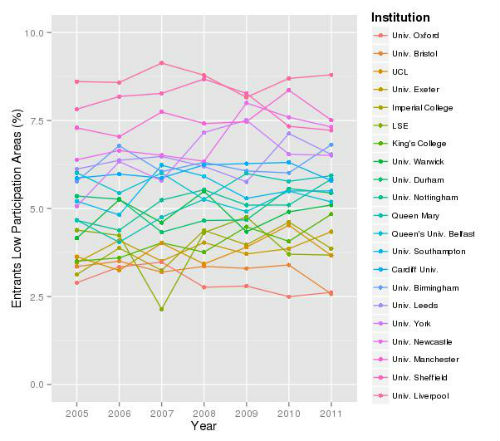
The Higher Education Funding council (HEFCE) has, however, shown that the participation of young people from disadvantaged backgrounds in higher education has increased since 2005. It is important to keep this in perspective. While the overall proportion of young people from low participation areas who go to university has risen by around 30 percent since 2005, the overall number of young people in higher education has also risen by around 30 percent since 2005, so the overall proportion of young people in higher education from low participation areas has remained almost unchanged over this period. The figure below shows how the percentage of entrants from low participation areas has changed between 2005 and 2011 for the universities in England and Wales which belonged to the Russell Group in 2012 (the University of Cambridge did not provide data in 2005 and is omitted). The Russell Group are what most people would think of as the elite universities. The figure shows that none of the Russell Group universities have shown a significant increase in the proportion of their entrants from low participation areas with the proportion of entrants from low participation areas remaining almost unchanged and ranging from around 8 percent for Liverpool and Sheffield to 3 percent for Oxford and Bristol.
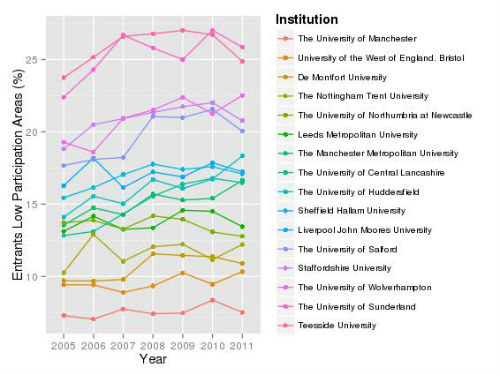
Many of the universities that have relatively large numbers of entrants from low participation areas are located in large urban areas in the North of England. The figure below shows how the number of entrants from low participation areas has changed between 2005 and 2011 for the universities with the highest number of entrants from low participation areas. In 2011, the universities with the highest number of entrants from low participation areas were Manchester Metropolitan University and Sheffield Hallam University, which both had around 1000 entrants from low participation areas. It is a little surprising that none of the major London universities have a large number of entrants from low participation areas with the highest number of entrants from low participation areas in 2011 being the University of Greenwich with 335 entrants in 2011. There would already seem to be large numbers of young people going to university across London.

In many of the institutions with high numbers of entrants from low participation areas, the number of entrants from low participation areas has been rising quite steeply over the last five years. In some institutions (e.g. Manchester University) the rise in the number of entrants from low participation areas reflects an overall rise in the number of students, with little change in the proportion of entrants from low participation areas (see figure below). In other institutions, however, rising student numbers over the last five years have been accompanied by an increase in the proportion of entrants from low participation areas (e.g. Teesside University). The proportion of young people who go on to university is relatively low in the North East (unlike London), so rising student numbers in areas such as Teesside and Sunderland would seem to be a positive development.
The increase in the number of students from low participation areas in certain universities raises the question of whether there might be a growing social polarisation in universities, with young people from less well-off backgrounds increasingly concentrated into certain institutions. In geography, various indices have been proposed to measure the extent of residential segregation between different groups, such as between Blacks and Whites in US cities. The most commonly used index is the dissimilarity index which can be interpreted as giving the proportion of the out (or disadvantaged) group that would need to move across areas (or institutions) to give an even geographical distribution. I haven’t been able to look at this in great detail as yet, but the dissimilarity index for better-off and less well-off entrants in English universities seems to have remained more or less unchanged at around 0.2 since 2005.
What this means is that if we took 20 percent of entrants from low participation areas at universities such as Manchester Metropolitan and instead sent them to Oxford the distribution of entrants from low participation areas would be roughly even across universities. It might seem disappointing that levels of social segregation between universities have remained unchanged since 2005 but given the recent changes to student funding it seems a more positive finding than might have been expected.


