| Uniform Colour | Colour’s Meaning | Casualties | Comments on the Data |
| Blue | Science and medical | 7 | |
| Gold | Command and helm | 9 | Includes Lee Kelso and Gary Mitchell who wore the old style chartreuse command and helm uniform. Also includes O’Neil, whose uniform was not listed, but can be observed in the episode The Galileo Seven. |
| Red | Operations, engineering and security | 24 | |
| Unknown | n/a | 15 | Includes nine killed by the galactic barrier in Where no “Man has Gone Before”, three Rigelian fever victims from Requiem for Methuselah and one unknown casualty of the dikironium cloud creature in Obsession. Also includes Sam and Barnhart who were not in standard uniforms when they died. |
| Table 1: Enterprise NCC 1701 casualties from episodes aired between September 8, 1966 and June 03, 1969 based on casualty figures from Memory Alpha. Note: Table does not contain casualties from the Mirror Universe or anybody killed and resurrected during an episode. | |||
A pie chart was created using Minitab to graphically view the data. It is obvious from the pie chart in Figure 1 that redshirts suffer most of the casualties. However, raw casualty figures are not very informative without knowing how many people were in each uniform. According to the Joseph’s Star Trek Blueprints, the only set of Enterprise blueprints endorsed by Paramount Pictures, the Enterprise’s 430 crew members consisted of 55 command and helm personnel, 136 science and medical personnel and 239 engineering, operations and security personnel. This means 16.4% of casualties were in command and helm, 5.4% were in science and medical and 10.0% were in operations, engineering and security. Of the remaining 27.3% of casualties, 12 were killed by contact with the galactic barrier or Rigelian fever, which could have affected personnel regardless of duty assignments.

Figure 1: Casualties by Uniform Color
| Table 2: Enterprise NCC 1701 casualties by uniform color. Note: There were 18 security department casualties out of the total of 24 redshirt casualties. This means the security department with 90 people lost 20% of its members | |||
| Uniform Colour | Casualties | Total Population | Casualties as Percent of Population |
| Blue | 7 | 136 | 5.1 |
| Gold | 9 | 55 | 13.4 |
| Red | 24 | 239 | 10.0 |
| Unknown | 15 | n/a | n/a |
| Total | 55 | 430 | 12.8 |
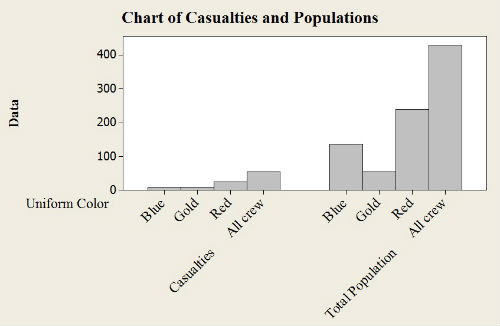
Figure 2: Chart of Casualties and Populations.
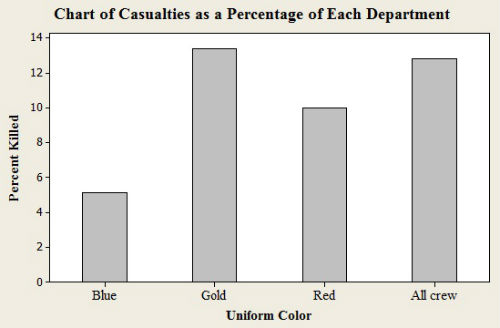
Figure 3: Chart of Casualties as a Percentage of Each department.
Based on an analysis of casualties that considers the overall total number of personnel in each color of uniform, wearing a redshirt may not be the automatic death sentence that it is popularly considered to be. On the other hand, 18 of the redshirt casualties were security personnel out of a total population of 90; 20% of the security department were casualties. Although wearing a redshirt may not of itself be particularly hazardous, personnel in a redshirt who are members of the security department should expect to pay a high premium on their life insurance.
Using what is known about Enterprise crew and casualty figures, suppose an Enterprise crew member has been killed. Discarding the 15 unknown casualties, redshirts consist of 60.0% of all fatalities where the uniform color is known; blue and gold uniforms are the remaining 40.0% of casualties. Redshirts are only 52.0% of the entire crew, but 60.0% of casualties, so what is the probability that the latest casualty was wearing a redshirt? The Enterprise often visits Starbases and takes on new crew members, so we assume sampling with replacement. Otherwise, the population size would change every time a crew member is killed.
Bayes theorem can be used to solve this. Bayes’ theorem solves for P(A|B), where P(A|B) is the probability of A given the B has happened. In this situation, that would be the probability that somebody is wearing a red shirt (A) if they are a casualty (B).
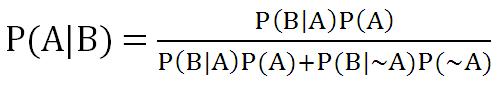
The formula is set up using what is known about the crew composition and the known casualty figures.
P(A)= Percent of redshirts in crew = 52.0%
P(~A) = Percent of crew that don’t wear a redshirt = 48.0%
P(B|~A) = Casualties not in a redshirt = 40.0%
P(B|A)= Redshirt casualties = 60.0%
The percentages are then converted into probabilities using decimal notation and plugged into the formula:
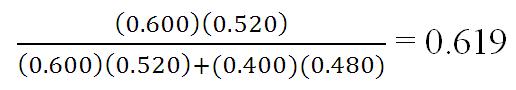
There is a 61.9% chance that any given casualty is wearing a redshirt. This really does not help the insurance premiums of operations, engineering and security personnel. Three departments wear redshirts so it may be worthwhile to take a deeper look at the data to determine if a wearing a redshirt is as hazardous as it appears to be. According to table 2, the security department suffered 18 out of the 24 red shirt deaths. What does Bayes’ theorem say about this?
Suppose a crew member finds a casualty with a redshirt. This may or may not be a member of security. Redshirts in security are 75.0% of all redshirt casualties and other redshirts are only 25%. However, security is only 37.7% of all people in a redshirt. How likely is the casualty to be a member of security?
P(A) = Percentage of redshirts in security = 37.7%
P(~A) = Redshirts that are not in security= 62.3%
P(B|~A) = Redshirt casualties not in security = 25.0%
P(B|A)= Redshirts casualties in security = 75.0%
The probabilities are then entered into the formula:
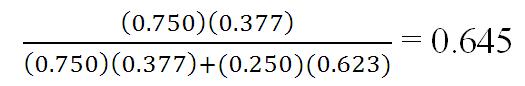
There is a 64.5% chance that any given casualty in a redshirt is a member of security. We can also conclude there is only a 35.5% chance that any casualty in a redshirt is not a member of security. This is in spite of security being only 37.7% of the entire population of redshirts. So what does this mean for red-shirted crew members not in security? Remember, security, operations and engineering wear redshirts. The 15 unknown crew members are not included in this calculation.
P(A) = Percentage of crew members in operations and engineering (redshirt, but not in security) = 34.7%
P(~A) = Percentage of crew members not in operations or engineering = 65.3%
P(B|~A) = Casualties not in operations and engineering = 85.0%
P(B|A)= Casualties in operation and engineering = 15.0%
The probabilities are plugged into the formula:
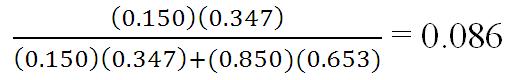
In spite of wearing a redshirt, there is only an 8.6% chance of a member of the operations or engineering departments becoming a casualty. These personnel should ensure that their life insurance plans are based on their departments and not their uniform color.
Although Enterprise crew members in redshirts suffer many more casualties than crew members in other uniforms, they suffer fewer casualties than crew members in gold uniforms when the entire population size is considered. Only 10% of the entire redshirt population was lost during the three year run of Star Trek. This is less than the 13.4% of goldshirts, but more than the 5.1% of blueshirts. What is truly hazardous is not wearing a redshirt, but being a member of the security department. The red-shirted members of security were only 20.9% of the entire crew, but there is a 61.9% chance that the next casualty is in a redshirt and 64.5% chance this red-shirted victim is a member of the security department. The remaining redshirts, operations and engineering make up the largest single population, but only have an 8.6% chance of being a casualty.
Red uniform shirts are safe, as long as the wearer is not in the security department.


