Our August 2018 cover story celebrates the 25th anniversary of the creation of R, the statistical programming language that became a subcultural phenomenon. While researching R’s history, community and culture, our reporter Nick Thieme interviewed a number of active R users and developers – and he invited them to tell our readers about some of the things they love most about R: specifically, the packages.
“Base R, as the vanilla version of R is called, provides the ability to load, export and transform data, to access probability distributions and mathematical functions, to run linear models on data, and to visualise results in visually pleasing ways,” writes Thieme. “Most importantly, it provides a programming syntax to build larger tools by tying these individual functions together.”
These “larger tools” are the packages that R users can download and run, which provide clever solutions to problems while saving users from having to write lines and lines of their own code.
Below, several of our interviewees write about their favourite R packages.
Package: stats
Authors: R Core team and contributors worldwide
By Peter Dalgaard, professor, Copenhagen Business School, and R Core team member
I am pretty much a bare-bones person when it comes to using R in practice. I do use CRAN packages, lately especially for finance and econometrics, but I also teach at the basic level, mostly with linear and generalized linear models as well as classical standard tests. These procedures are in the “stats” package, which was formed in R 1.9.0 by aggregating several packages with the lm/glm model code (from the “Blue Book” of S) which had been in R from the outset, with roots going back to GENSTAT and the pioneering work at Rothamsted.
The package contains the standard distributions and random number generators, many classical tests, linear and generalized linear models, with the associated model formula machinery, nonlinear models, basic time series, smoothing, and more. It is essentially a complete toolbox for practical statistics, although of course some tools are either too specialized or too extensive to be included.
Historically, the availability of the functionality of the stats package probably played an important part in establishing R as a credible multi-purpose tool for general statistics.
An elementary introduction to statistics can be done using tools from the stats package, with the addition of a few specialized packages, e.g. “survival” for biostatistics. However, it should be noted that this assumes that data exist in a ready-to-process form, or at least nearly so. That is, one would typically bypass the complexities of initial data handling. Some will be coming to R specifically for data handling and graphical presentations; for these purposes, a number of important and popular tools have been developed recently; see, for instance, the meta-package “tidyverse”.
Package: purrr
Authors: Lionel Henry and Hadley Wickham
By Julia Silge, data scientist at Stack Overflow
Like most other data scientists working in industry, I spend a lot of my time wrangling data. Before I can summarize data for insight, train a model, or make a beautiful chart, I have to transform data into the right shape and format for what I want to do. This wrangling work is a central part of my work as a data scientist, both in terms of effort spent and importance, so I choose to use tools that make these tasks as efficient and as enjoyable as possible. The R packages that make my life better here include “dplyr”, “tidyr”, and friends – but if I had to pick a favorite that has brought me the most delight, I would choose “purrr”.
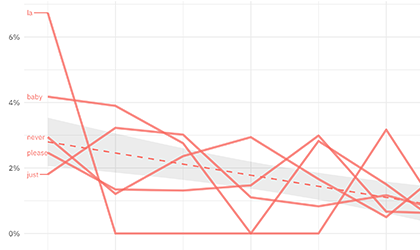
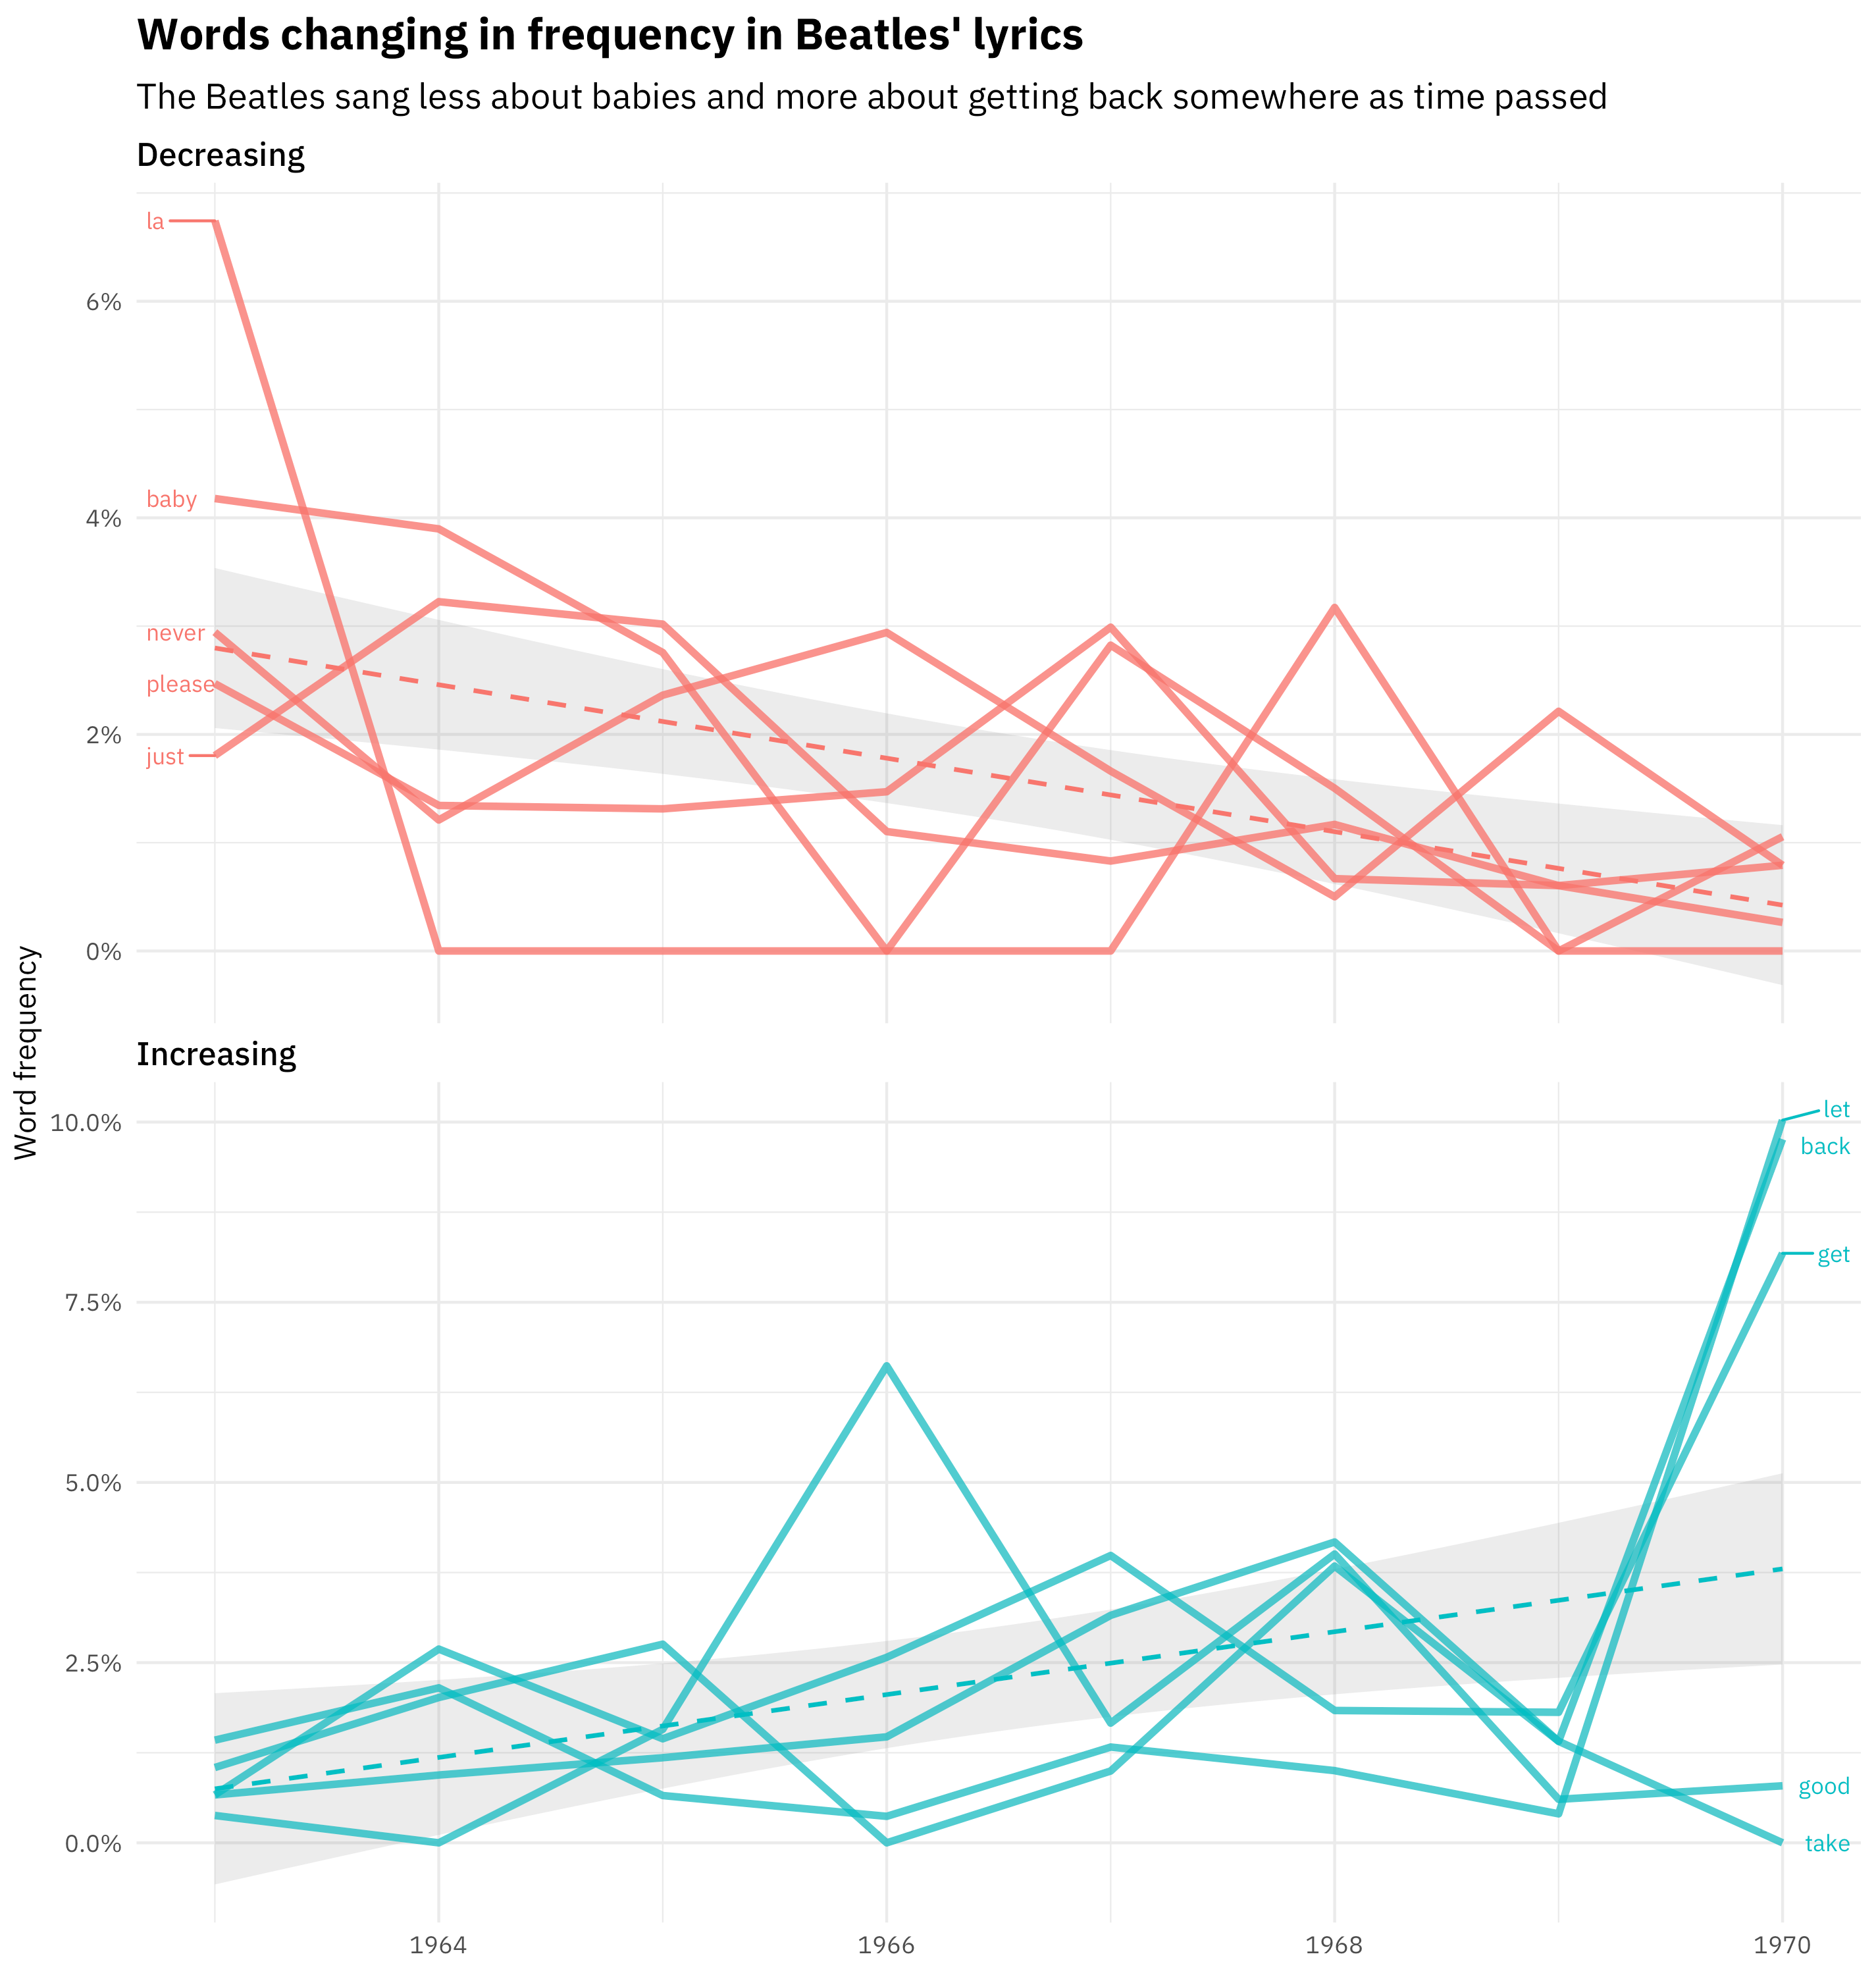
The purrr package enhances R’s functional programming capabilities within the framework of tidy data principles. It draws inspiration from Haskell and Scala, but is firmly planted within tidyverse philosophy and allows me to fluently move from data manipulation with dplyr to applying functions to that data. For example, I recently used Josiah Parry’s delightful “geniusR” package to explore Beatles’ lyrics. I used purrr’s map2() function to access the lyrics for each of the Beatles’ studio albums, and then used purrr’s map() function to fit a logistic regression model for each word in the lyrics. I could then explore which words increased and decreased during the Beatles’ recording career.
What purrr offers me as a busy data scientist is the ability to write readable, expressive code for iteration and applying functions to data. Few other packages have transformed onerous tasks into painless ones for me in such a gratifying way.
Package: GenomicRanges
Authors: Patrick Aboyoun, Hervé Pagès and Michael Lawrence
By Michael Lawrence, bioinformatics scientist at Genentech, and Robert Gentleman, vice president of computational biology at 23andMe, and co-creator of R
The advent of high-throughput molecular technologies has revolutionized our ability to measure and analyze genomic data. These data provide valuable insight into the underlying mechanisms of diseases like cancer and Alzheimer’s. There are many problems in genomics that require statistical expertise, so it is important to develop software to manipulate and analyze these data.
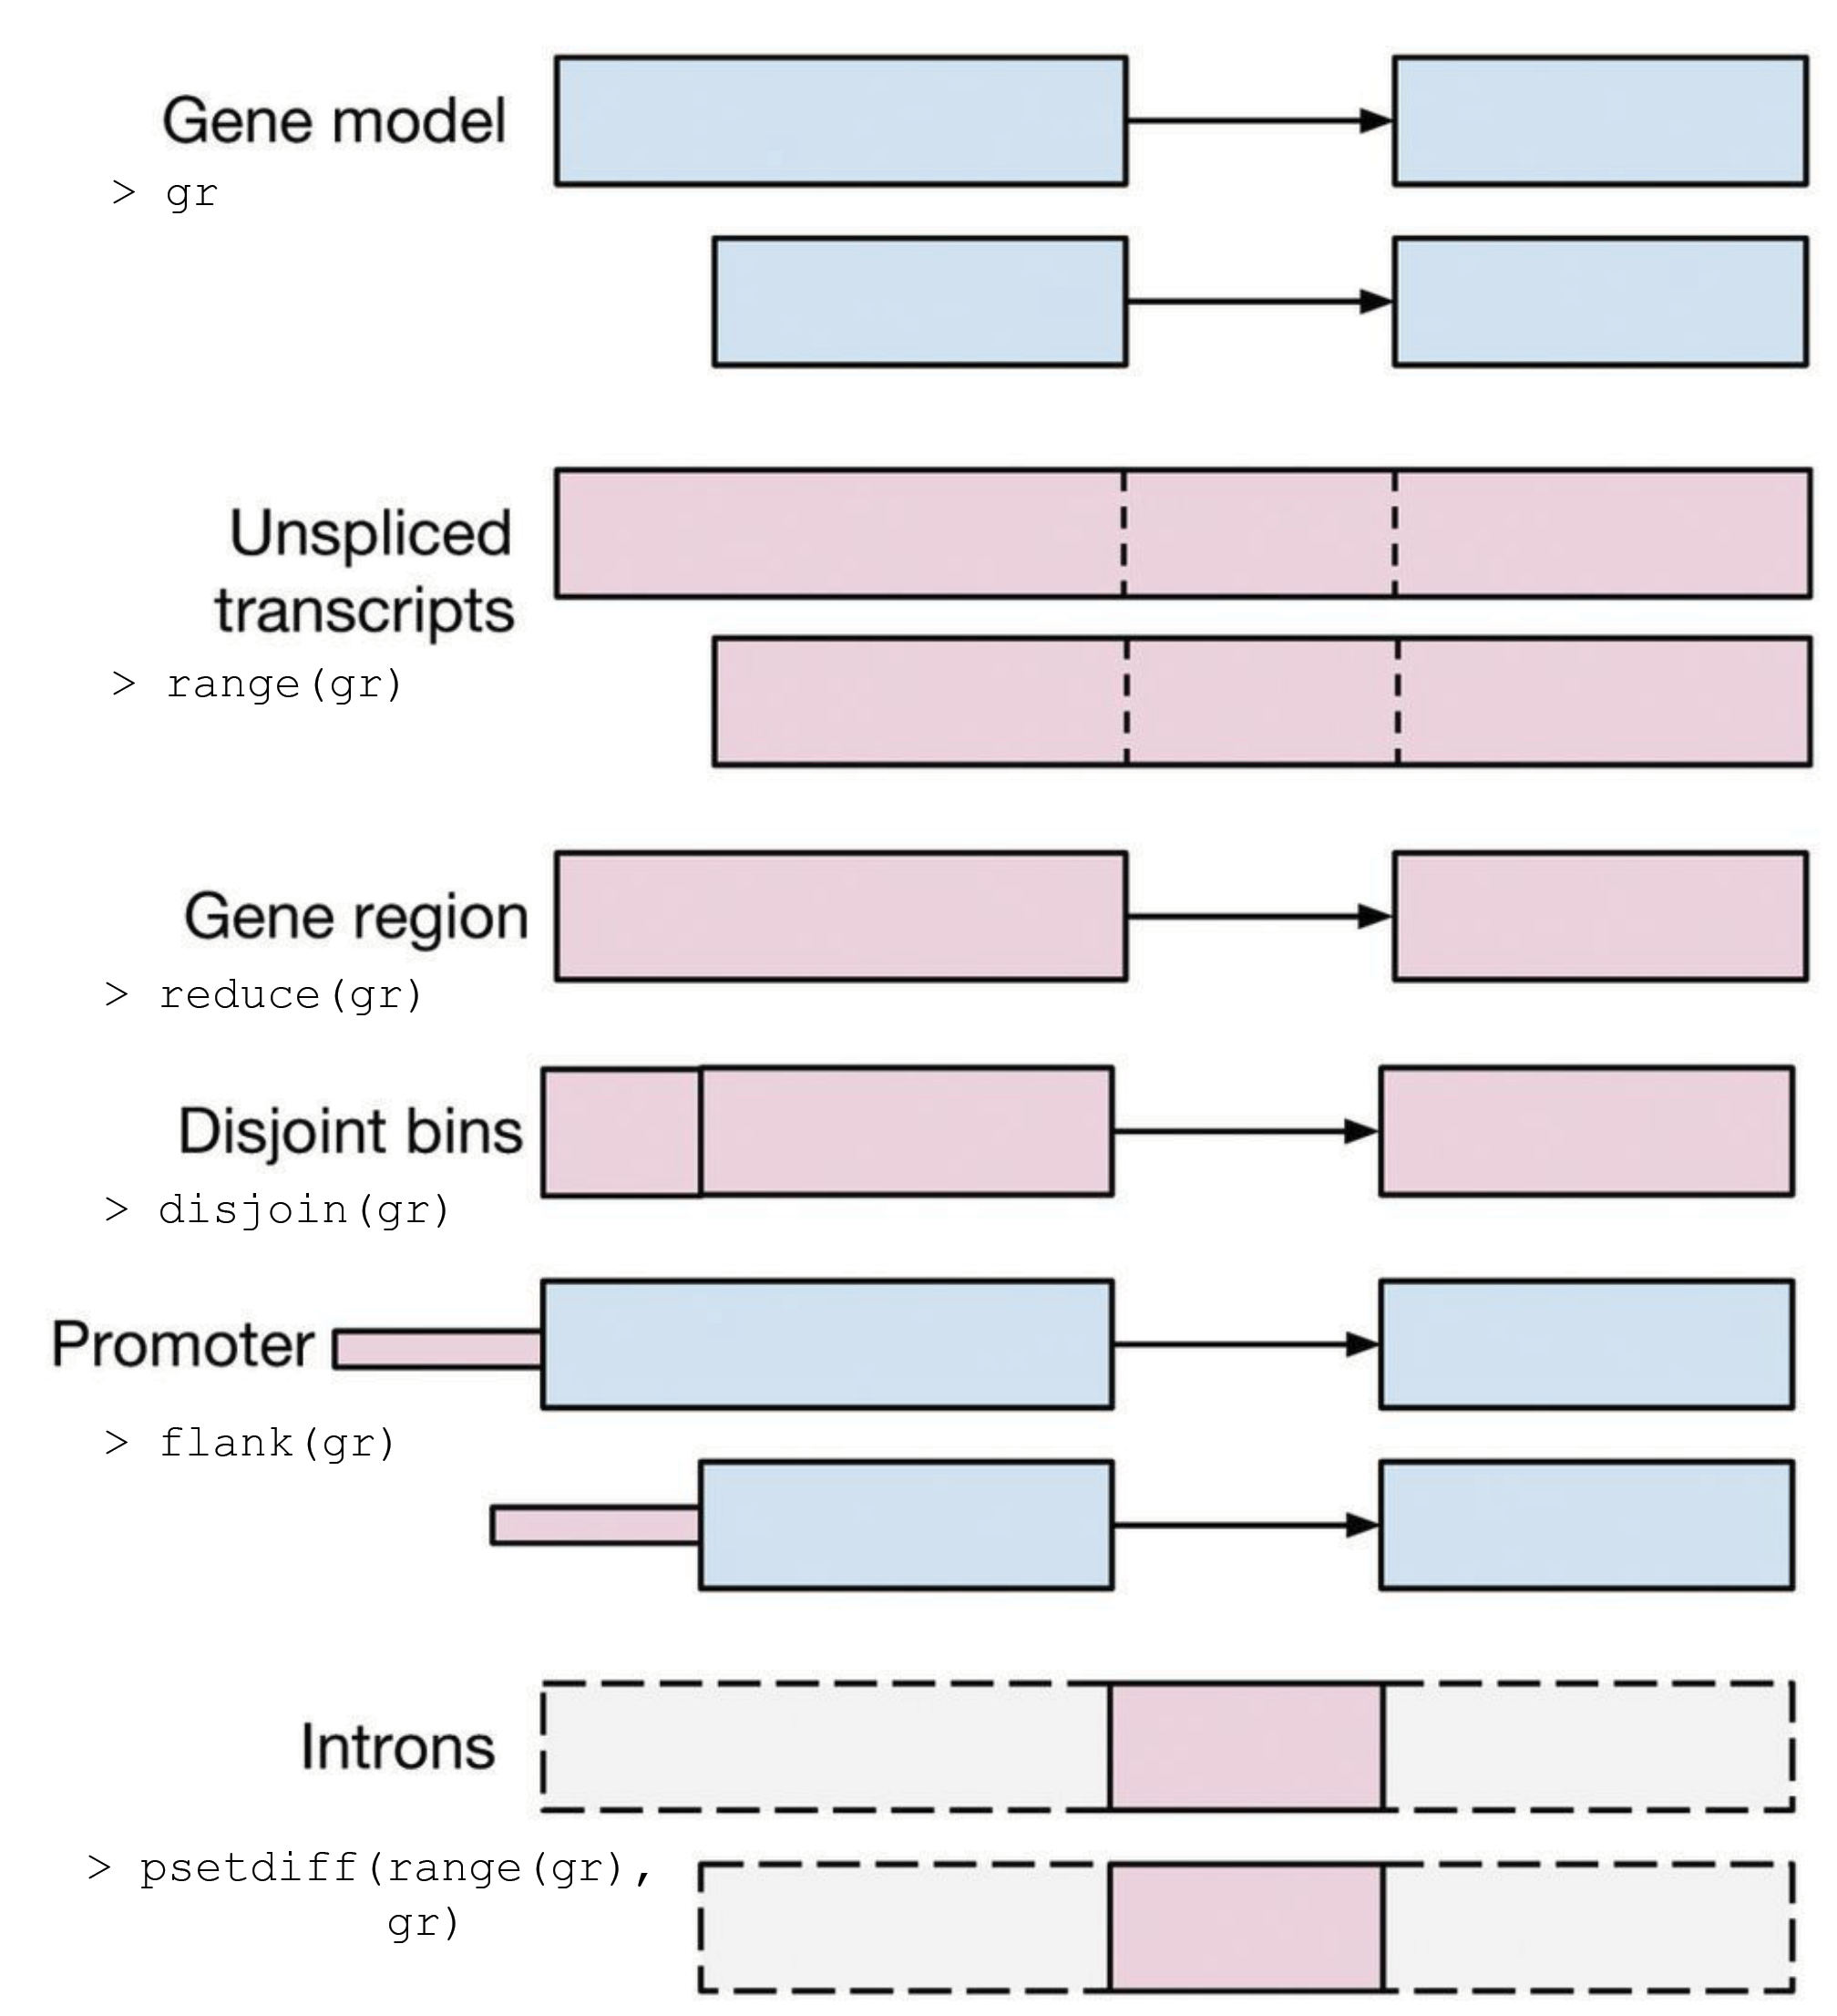
We can think of a chromosome as a long sequence of letters (A,C,T, or G) and the interesting parts of the chromosome are typically ranges, such as genes, protein binding sites, or sequences that vary in association with disease. The genomic range is a special type of data (a tuple of chromosome, start and end) with special semantics. Thus, analyzing genomic ranges requires new data structures and a new algebra of operations.
The GenomicRanges package, a core part of Bioconductor, provides just that. The figure illustrates some of the most important algebraic operations.
Hundreds of Bioconductor packages depend on GenomicRanges and apply it to implement cutting-edge statistical methods that are driving biological discoveries and healthcare innovations. Range operations also arise in other contexts, such as time-series analysis and text processing, and the IRanges package, which underlies GenomicRanges, supports more general applications.
- If you are an R user, please tell us about your favourite R package in the comments.


