
Tropical storms are a seasonal feature of the Earth's oceans. Depending on where these terrifying phenomena occur they are called either typhoons (northwest Pacific Basin) or hurricanes (northeast Pacific and northern Atlantic basins) but in general they are referred to as cyclones. Often, once they reach the coast and move inland, they hurt (and sometimes kill) thousands of people and affect large swathes of territory.
Many feared this would be the case with one recent cyclone, which quickly gathered force in the Eastern Pacific basin before moving towards the western coastal Mexican states of Nayarit, Jalisco and Colima. Eventually, on 23 October, the cyclone changed from a tropical storm to a Category 5 hurricane; contingency plans were activated.
The storm was named Patricia, following a practice dating back to the mid-20th century, whereby storms are given personal names so that they may be easily identified by the public. Unlike other devastating storms, such as hurricane Katrina (2005) and typhoon Haiyan (2013) – which caused extensive loss of life and massive economic damage in, respectively, the Gulf coast of the USA, and in Southeast Asia – Patricia quickly degraded to a Category 2 tropical storm, first landed on a mountainous, sparsely populated area, and caused relatively little damage (see Figure 1).
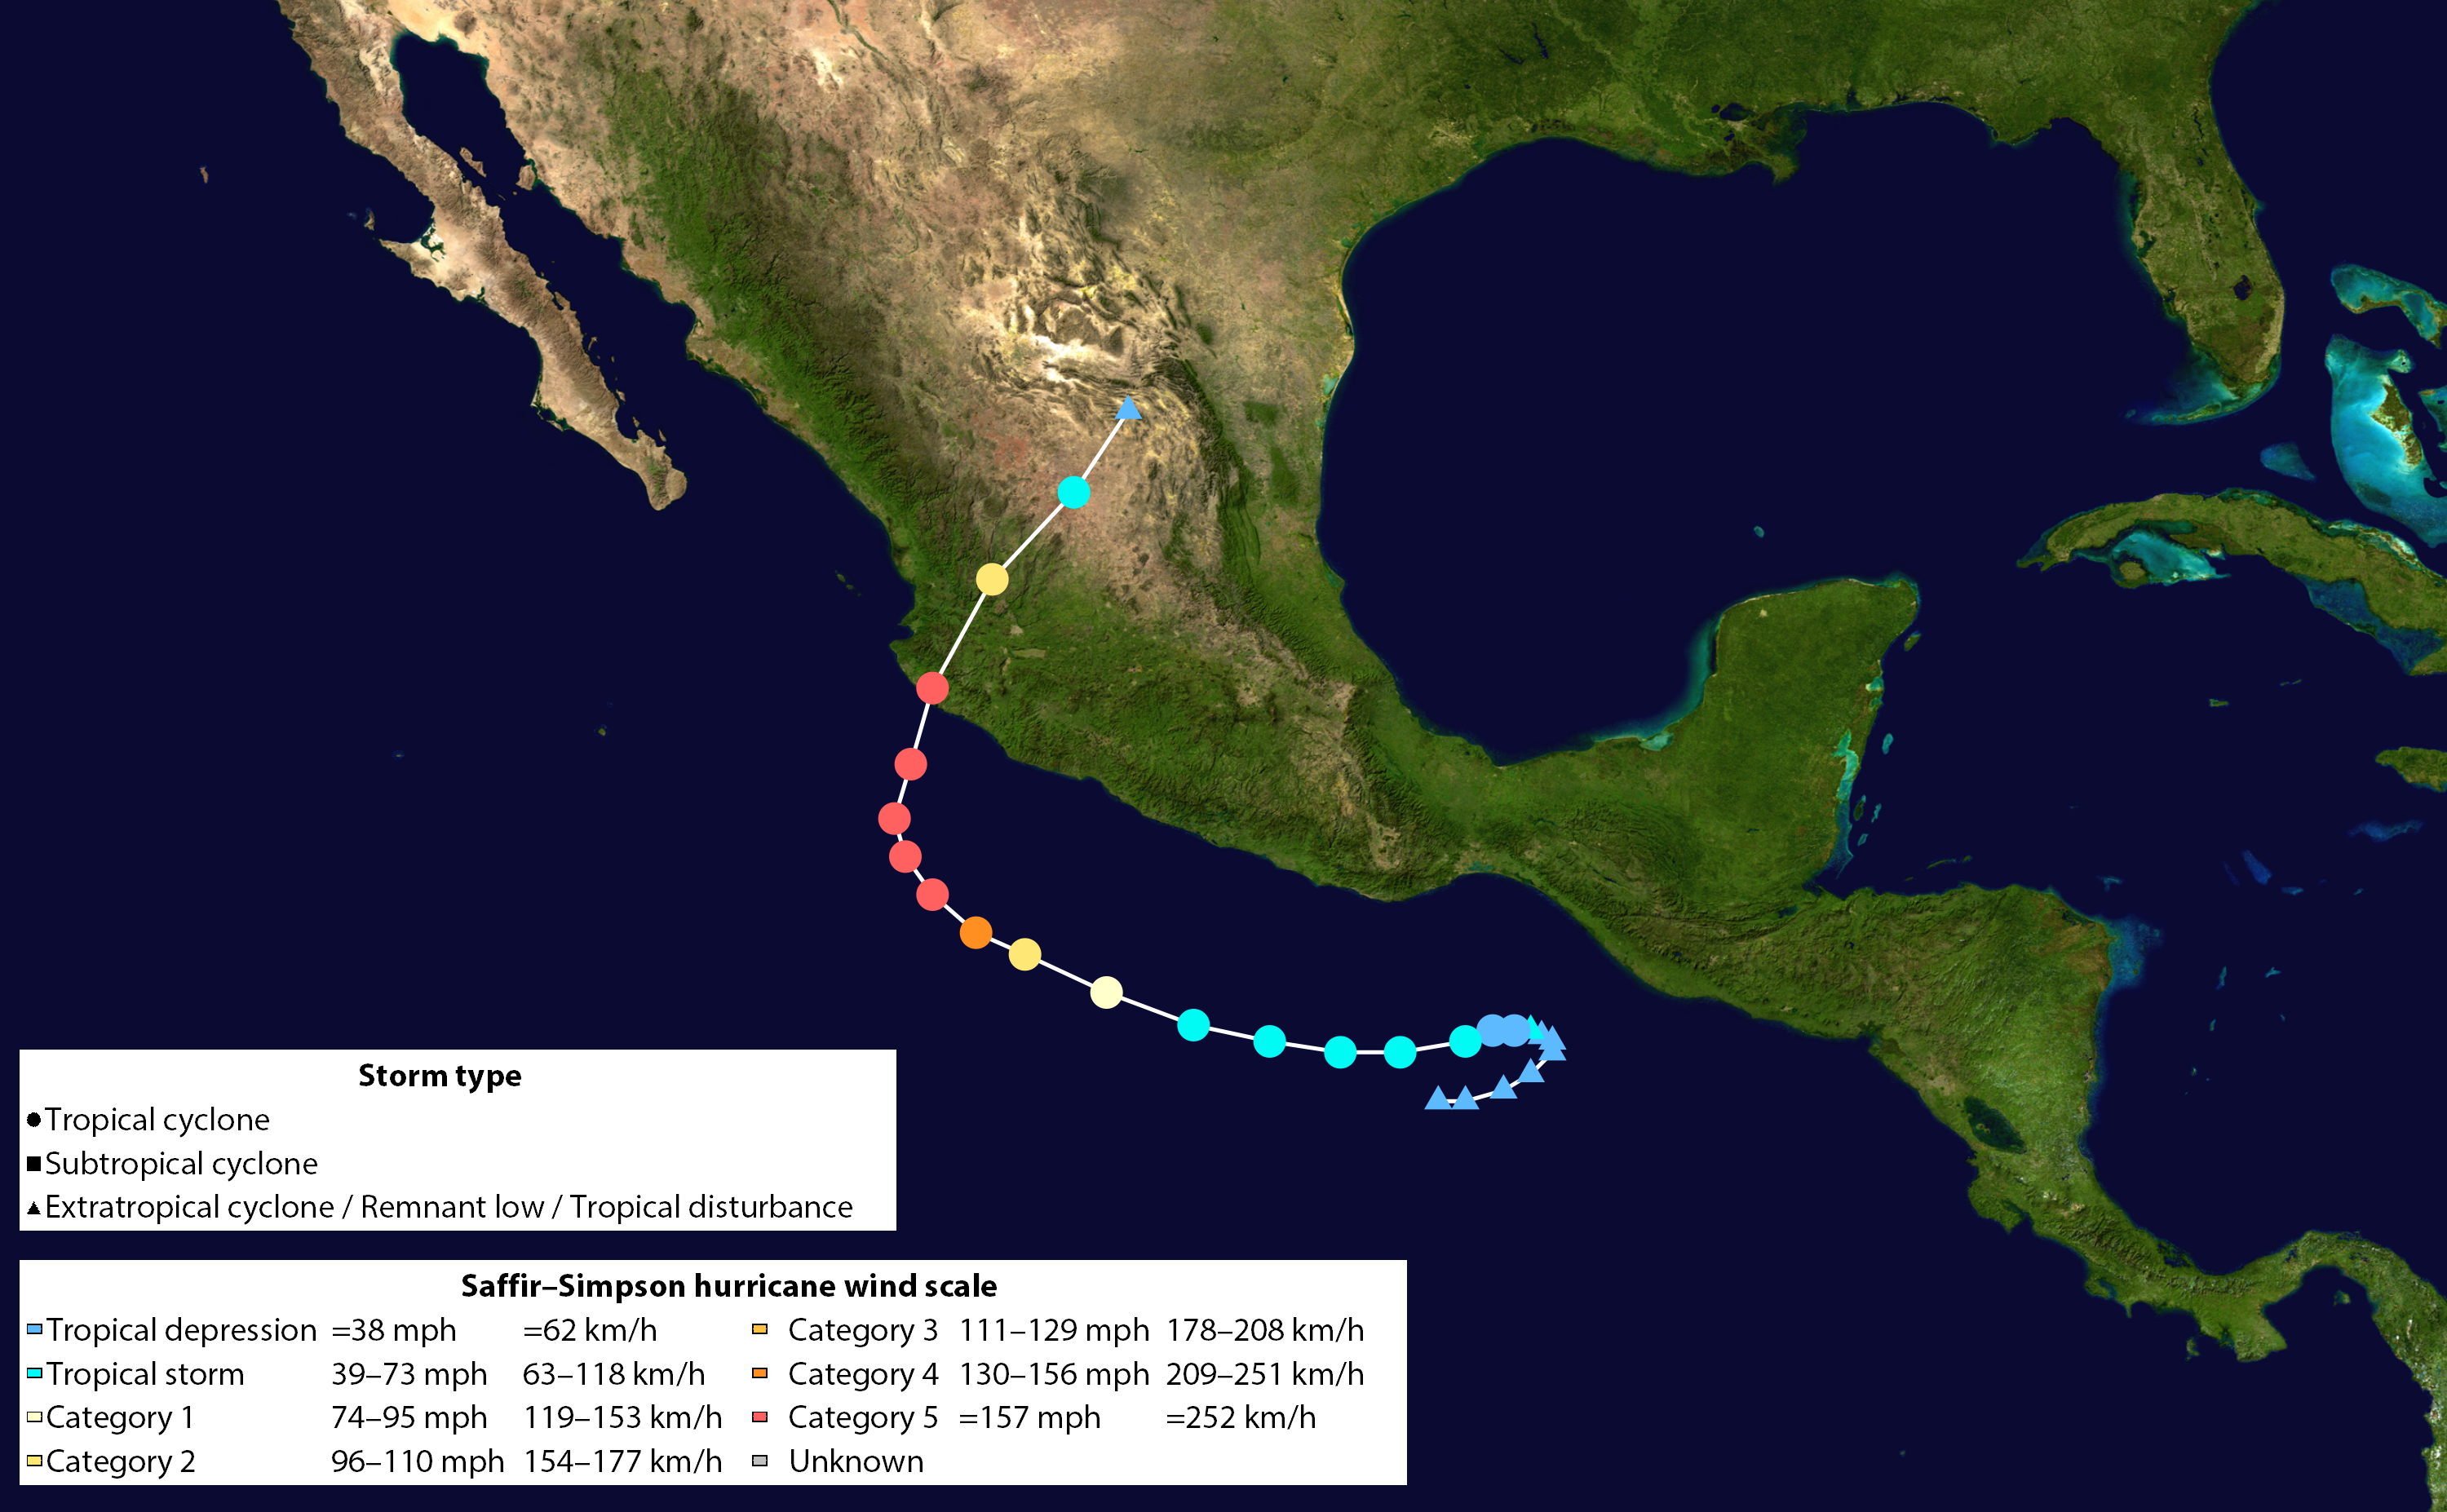
Figure 1. The points show the location of the storm at 6-hour intervals. The colour represents the storm's maximum sustained wind speeds as classified in the Saffir–Simpson hurricane wind scale, and the shape of the data points represent the nature of the storm, according to the legend.
Luck was clearly on Mexico’s side as prior to the category downgrade, Patricia was described as being the most powerful tropical cyclone ever recorded. But is this actually the case?
There are several scales to rank the intensity of tropical storms. One of the most common is the Saffir-Simpson scale (Table 1), which was proposed in the early 1970s and modified in the 2010s as a pure wind speed scale, based on the maxima of average 1-minute sustained wind speeds typically measured at 10m above the Earth's surface.
| Category | Sustained wind speed | Type of damage due to hurricane winds |
| 1 | 74 – 95 mph | Very dangerous winds will produce some damage |
| 2 | 96 – 110 mph | Extremely dangerous winds will cause extensive damage |
| 3 | 111 – 129 mph | Devastating damage will occur |
| 4 | 130 – 156 mph | Catastrophic damage will occur |
| 5 | ≥157 mph | Catastrophic damage will occur |
Table 1. Saffir-Simpson hurricane wind scale
There is also the Dvorak technique, developed between 1969 and 1984, which uses visible and infrared satellite images to estimate the intensity of a tropical storm. Its outputs loosely correspond to ranks of maximum sustained wind speed and minimum barometric pressure.
Neither of these scales account for the many other variables related to the impact a storm might have, such as duration, accumulated energy, size, amount of rain and velocity of barometric pressure fall. However, the maximum sustained wind speed is regarded as a working definition of storm intensity.
Patricia’s maximum sustained 1-minute wind speed was 201.95 mph (325 kmh) and its minimum pressure was 879 mbar (hPa). It was estimated at 8.3 on the Dvorak scale, which has an upper limit of 8. To find out if this truly was the most powerful storm on record, I collected data1 on the 240 category 4 and 5 tropical storms recorded since 1950; 95 occurred in the Eastern Pacific, 93 in the North Atlantic and 52 in the Western North Pacific basin. Each storm had estimated maximum sustained 1-min wind speeds of at least 133 mph.
Figure 2 shows how North Western Pacific typhoons have significantly higher maximum wind speeds and lower pressure than storms in other basins; the database shows censoring at 900 hPa, and rounding for some large wind speeds for this particular basin. Figure 2 also shows that there have been several typhoons with higher maximum wind speed and lower minimum pressure than Patricia, though they occurred over 50 years ago. However, Patricia is by far the most intense hurricane in the Eastern Pacific basin.
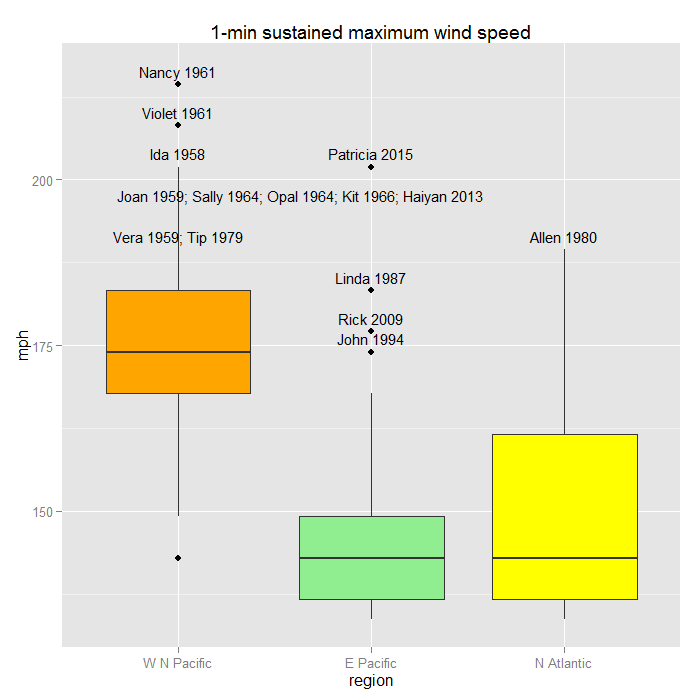
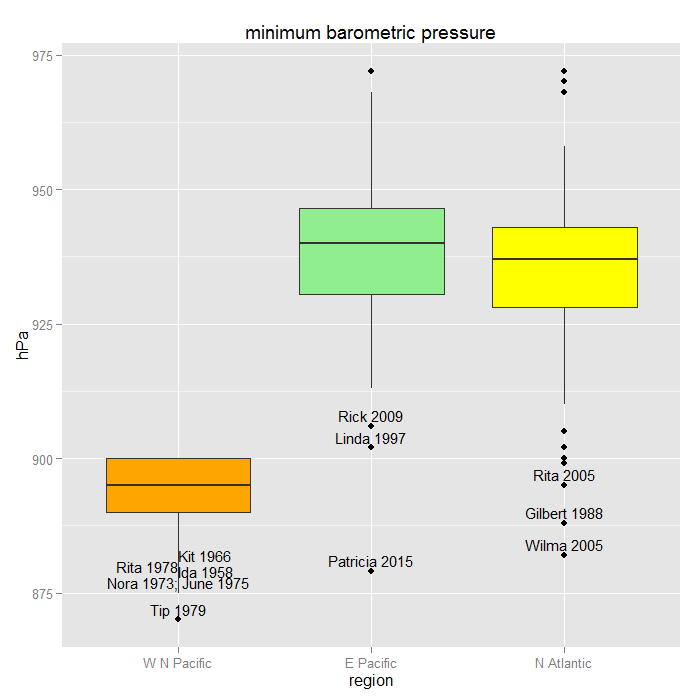
Figure 2. Regional distributions of (a) maximum sustained wind speed and (b) minimum pressure in 240 tropical storms
Figure 3 shows the yearly extrema of wind speed and barometric pressure. Accurate satellite measurements of storm wind speeds have been available since around 1970; however, we cannot say whether earlier measurements of maximum sustained wind speed or minimum pressure were over- or underestimated. Restricting comparisons to post-1970 storms, Patricia is definitely the most intense storm in terms of wind speed, as well as having the fifth lowest recorded pressure: only typhoons Nora in 1973 (875), June in 1975 (875), Rita in 1978 (878) and Tip in 1979 (870) had lower values.
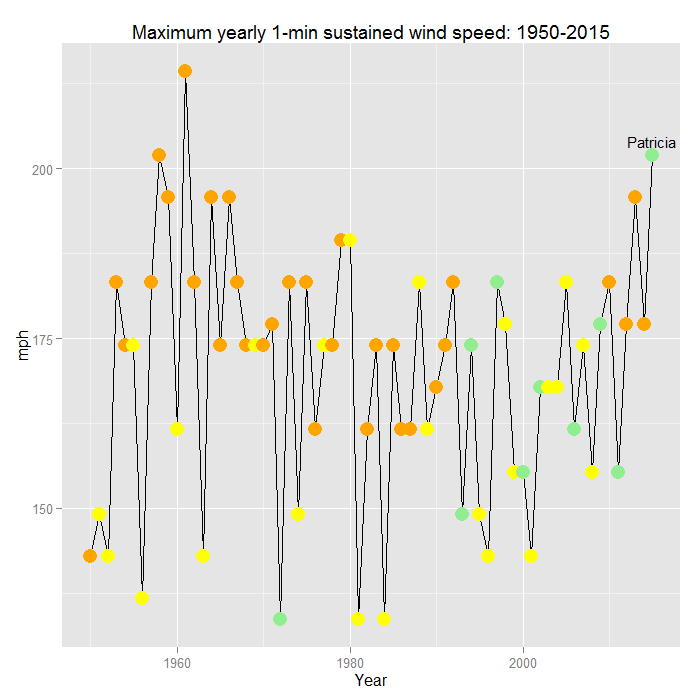
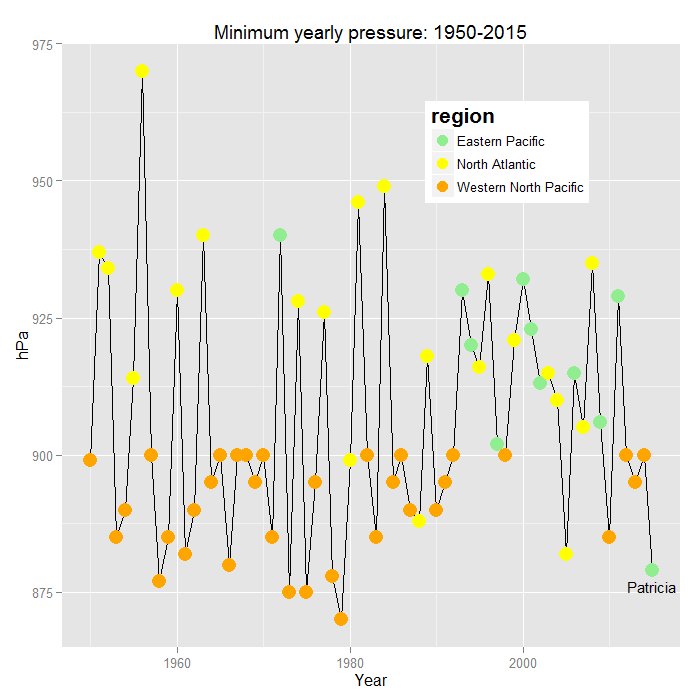
Figure 3. Yearly extrema for wind speed and pressure, 1950 – 2015
Thus there seems to be strong evidence for Patricia’s intensity being very likely the largest ever recorded, certainly in terms of wind speed. Further, to forecast the speed of the next record-breaking hurricane I fitted the model for interval prediction of records from an extreme value parent distribution described by Arnold, Balakrishan and Nagaraja2 to the sequence of annual maxima for wind speed, as shown in Figure 4.

Figure 4. Annual maximum wind speeds, 1970-2015
The sequence of record wind speeds, starting in 1970, is {173.98, 177.09, 183.30, 189.52, 195.73, 201.95} mph, corresponding to the years {1970, 1971, 1973, 1979, 2013, 2015}. Based on this sequence the predicted value for the next wind speed record is 204.95 mph with 90% prediction interval equal to (201.95, 210.73) mph. Excluding Patricia from this calculation, the predicted value and 90% interval would be 198.68 and (195.73, 204.92) showing that this latest record-breaking storm increased by 3% the predicted value for the following record.
The recent occurrence of huge storms Wilma, Haiyan and Patricia have renewed the discussion on whether a Category 6 should be introduced in the Saffir-Simpson scale for storms with sustained wind speed over 174 mph. However, the late Robert Simpson, one of the meteorologists who defined the scale, argued that such modification is not useful. He said: "When you get up into winds in excess of 155 mph… if that extreme wind sustains itself for as much as six seconds on a building it's going to cause rupturing damages that are serious no matter how well it's engineered.” Category 5 storms appear often enough, and only chance and preventive measures can help reduce the loss of life and resources that they usually leave in their wake.
References
- From the lists of category 4 and 5 hurricanes available at https://en.wikipedia.org/wiki/Lists_of_Atlantic_hurricanes, and https://en.wikipedia.org/wiki/List_of_Pacific_hurricanes
- Arnold BC; Balakrishnan N; Nagaraja HN (1998) Records, Wiley, New York; section 5.7.2.


