Plastic waste is found in ocean waters, on beaches and in the marine food chain. Counting it all would be impossible, but the approximate scale of the problem can be estimated. In the October 2017 print edition of Significance, I highlight the many roles of statistics in describing and tackling this global issue.
But as well as estimating the quantity of plastic that enters the oceans each year, researchers also want to understand where all that plastic goes. One way to do that is to use an existing dataset of GPS-tracked floating buoys, known as drifters. These drifters report their coordinates several times a day, and the resulting trajectories expose the spaghetti-like pathways taken by floating objects.
Floating plastic can take many pathways, and is not certain to follow the most powerful currents. By counting the number of drifters which travel from one segment of the ocean to another, a stochastic model for floating debris is created. A stochastic model reduces an otherwise incomprehensible transport system to a probability-based representation of flow, allowing for random variation. This can be compared with a road network: cars (plastic) generally follow main roads (ocean currents), but may move between lanes almost at random (turbulence) and slip into side streets (eddies). The flow is inherently stochastic. To understand the flow field, it would be an expensive process to model the behaviour of individual objects. Instead, we count objects – in this case, drifters – as they enter and leave parts of the ocean. This is a neat way of accounting for the many complex physical processes, without directly representing them.
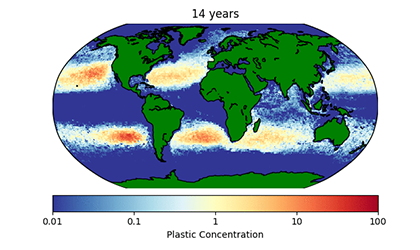
The stochastic model requires some initial debris concentration values. It then calculates the transport away from the release area and the resulting concentrations wherever it spreads. The GIF below shows the model in action.
 ABOVE A model of the ocean surface currents to predict the motion of floating debris, such as plastic pollution. The model transport is derived from the pathways taken by GPS-tracked buoys, which float freely with the currents. To identify regions where plastic accumulates, modelled debris is released uniformly throughout the ocean. The video shows the relative concentration of model debris per 1o grid cell (with an initial concentration of 1 per grid cell). Regions of clockwise/anti-clockwise currents in the middle of oceans – known as ocean gyres – attract and accumulate debris; these features are visible within 3 years of the global debris release. After a decade, the inner regions of each ocean basin contain large “patches” of accumulated debris, where the concentrations can be over 10,000 times larger than other parts of the ocean (i.e. compared to the Equator or near Antarctica).
Other articles in this series
- Plastic bag charge: Measuring success
- A climate on the edge: Predicting environmental tipping points
About the author
Ronan McAdam is a PhD researcher in physical oceanography at the Department of Physics and the Grantham Institute of Climate Change and the Environment, Imperial College London.


