
I have decided to build a model to try to predict the results of the upcoming snap general election in the UK. I’m sure there will be many people attempting this, from various perspectives and using different modelling approaches. But I have set out to develop a fairly simple (though, hopefully, reasonable) model. In the process of describing this to you, I hope to shed some light on how statisticians build predictive models.
We start with the data, which come from national voting intention polls conducted by a number of research agencies, including YouGov, ICM and Opinium.
Arguably, this election will be mostly about Brexit; there surely will be other factors, but because this election comes almost exactly a year after Britain’s referendum on membership of the European Union (EU), it is a fair bet to suggest that how people voted back then, and how they still feel now, will massively influence the election result.
Luckily, all the polls I have found report data in terms of voting intention, broken down by Remain/Leave votes during the EU referendum. Using these polls, I am looking to predict the results of the seven main political parties – Conservatives, Labour, UKIP, Liberal Democrats, SNP, Green, and Plaid Cymru – plus all “Others”. Also, for simplicity, I’m considering only the results for the 632 constituencies in England, Scotland and Wales, not the 18 Northern Ireland constituencies. This shouldn’t be a big problem though, as elections are generally a local affair in Northern Ireland, with the mainstream British parties not playing a significant role.
As well as recent polling data, I also have available data on the results of both the 2015 general election and the 2016 EU referendum. I had to do some work to align these two datasets, as the referendum did not use the same geographical resolution as is typically used during general elections. I therefore mapped the voting areas used in 2016 to the parliamentary constituencies and have recorded the proportion of votes won by my eight parties in 2015, as well as the proportion of Remain votes in 2016.
For each constituency, I therefore have a distribution of election results, which I can use to determine the average outcome, as well as various measures of uncertainty. In a nutshell, my model is all about (a) re-proportioning the 2015 and 2017 votes based on the polls; and (b) propagating uncertainty in the various inputs.
But before I can start making (what I hope will be) reliable predictions, I need to tune the model a little more.
Priors and posteriors
My model is built using a Bayesian approach, one feature of which is that the model starts with a “prior” distribution for each party’s vote share, and this prior is then updated based on the results of the polling data to create a “posterior” distribution. This posterior is the model’s prediction of a party’s likely vote share.
I initially set the model to have “vague” priors – meaning that, in the absence of polling data, each party was expected to do equally as well as any other party. When I ran the model by simply “forward sampling” (that is, pretending I had no polling data) to check what my priors implied, the prior vote share for each party was close to 0.12 – which is consistent with the intended vague structure, but is arguably not very realistic. Nobody would expect all the main parties to get roughly the same share of the vote before observing any of the polling data.
My concern was that with vague priors, the model would take the polls too much at face value: in other words, the posteriors would be heavily swayed by the polling data because the information included in the priors was fairly weak. My model would therefore have too great a reliance on the polls being correct, when recent experience tells us that may not be the case.
To address this, I went back to historical data on the past three general elections (2005, 2010 and 2015) and used these to define some prior expectation for the parameters determining the log relative risk of voting for party p in comparison to the Conservatives, among Leavers and Remainers.
There are many ways one can do this. My approach was to first weigh the observed vote shares in England, Scotland and Wales to account for the fact that data from 2005 are likely to be less relevant than data from 2015. I arbitrarily used a ratio of 3:2:1, so that the latest election weighs three times as much as the earliest election. (Of course, if this was “serious” work, I’d want to check sensitivity to this choice.)
This gave me the following prior probabilities for each party (in descending order):
| Conservative | 0.366639472 |
| Labour | 0.300419740 |
| Liberal Democrat | 0.156564215 |
| UKIP | 0.078807863 |
| Other | 0.034759663 |
| SNP | 0.032555551 |
| Green | 0.024220681 |
| Plaid Cymru | 0.006032815 |
I was still not entirely satisfied because I thought UKIP and possibly the Lib Dems may be subject to different dynamics at this election, and these dynamics would not be reflected in the historical data. For example, UKIP seems to have had problems re-inventing itself after the Conservatives so efficiently took up the role of Brexit paladins. So I decided to re-distribute some of the weight for UKIP to the Conservatives and Labour, the two parties that were arguably most affected by the surge in popularity of UKIP in recent elections.
In an extra twist, I also moved some of UKIP’s historical vote share to the SNP, to safeguard against the fact that the latter have a much higher weight where it counts for them (in Scotland) than the national average suggests. (But I could have done this more correctly by modelling the vote in Scotland separately).
These historical shares can be turned into relative risks by simply re-proportioning them by the Conservative share, thus giving me some average relative risk for each party (against the reference = Conservatives).
I then ran my model to see what the differences were by assuming the original “minimally informative” (vague) priors, and the new “informative” versions of the priors.
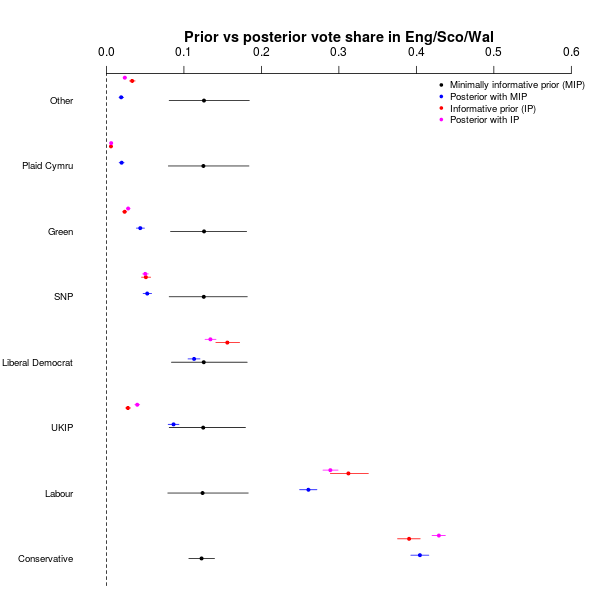
Here, the black dots and lines indicate the mean and 95% interval of the minimally informative prior (MIP), while the blue dots and lines are the posterior estimated vote shares for that model. The red and magenta dots/lines are the prior and posterior results for the informative model (IP), based on the historical/subjective data.
Interestingly, the polls that were available at the time seemed to have quite substantial strength, because they were able to move most of the posteriors – specifically, the Conservatives, Labour, SNP, Green, Plaid Cymru and Other). The differences between the two versions of the model were not huge, necessarily, but they were important in some cases.
The actual results, in terms of parliamentary seat predictions, are as follows:
| Party | Seats (MIP) | Seats (IP) |
| Conservative | 371 | 359 |
| Labour | 167 | 178 |
| SNP | 53 | 51 |
| Liberal Democrats | 30 | 40 |
| Plaid Cymru | 10 | 3 |
| Green | 1 | 1 |
Substantively, the data + model assumptions seemed to suggest a clear Conservative victory in both versions. But the model based on informative/substantive priors seemed to me to be a much more reasonable prediction − strikingly, the minimally informative version predicts a ridiculously large number of seats for Plaid Cymru.
The horserace results
As the days and weeks have gone by, I’ve been updating my election forecast model – nothing has changed in the general structure of the model, but I’ve been feeding in new polling data as the campaigns evolve. Here are the results as of 22 May.
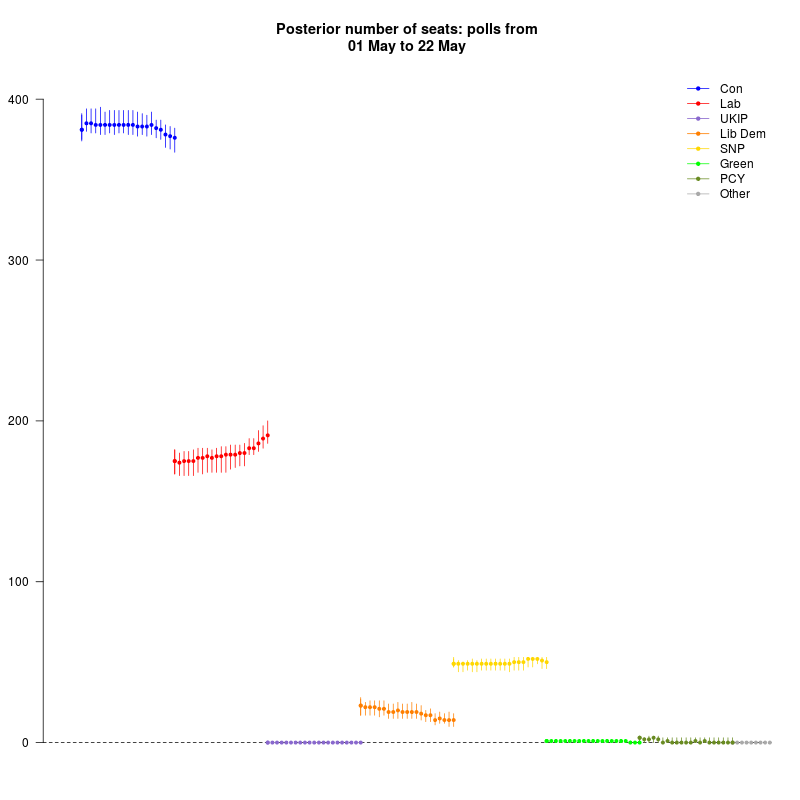
The dynamic forecast (which, for each day from 1–22 May, considers only the polls available up to that point) shows an interesting progression for Labour, who seem to be picking up more seats than initially expected. They are still a long way from the Tories, who are declining slightly. Also, the Lib Dem seat projections are going down and the results also seem to suggest a poor result for Plaid Cymru in Wales too (the model was forecasting up to 4 seats before, where now they are expected to get 0).
I also played around with the issue of coalitions – there’s still some speculation in the media that the “progressives” (Labour, Lib Dems and Greens) could try and help each other by not fielding candidates against one another in selected constituencies, so as to maximise the chance of ousting the Conservatives. I’ve simply used the model prediction and (most likely unrealistically!) assumed 100% compliance from the voters, so that the coalition would get the sum of the votes originally predicted for each of the constituent parties. Here’s the result.
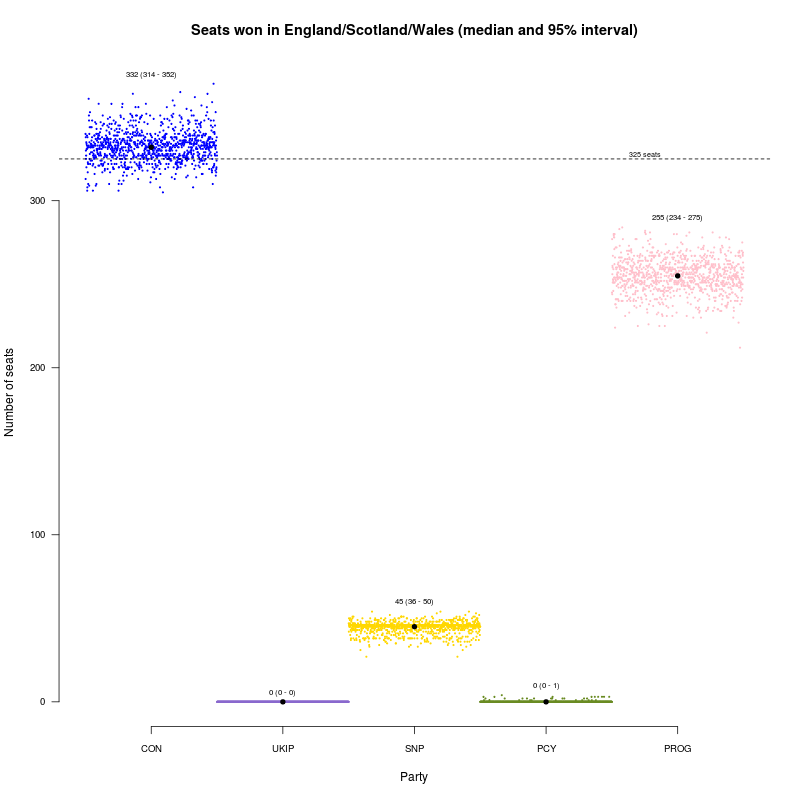
The progressives come much closer to victory, and the probability of an outright Tory majority is now much smaller, but still my model feels a Conservative win is still the most likely outcome.
That’s true even after the latest update, which accounts for polls fielded in the wake of the Manchester Arena bomb attack. Here are the results as of 26 May.
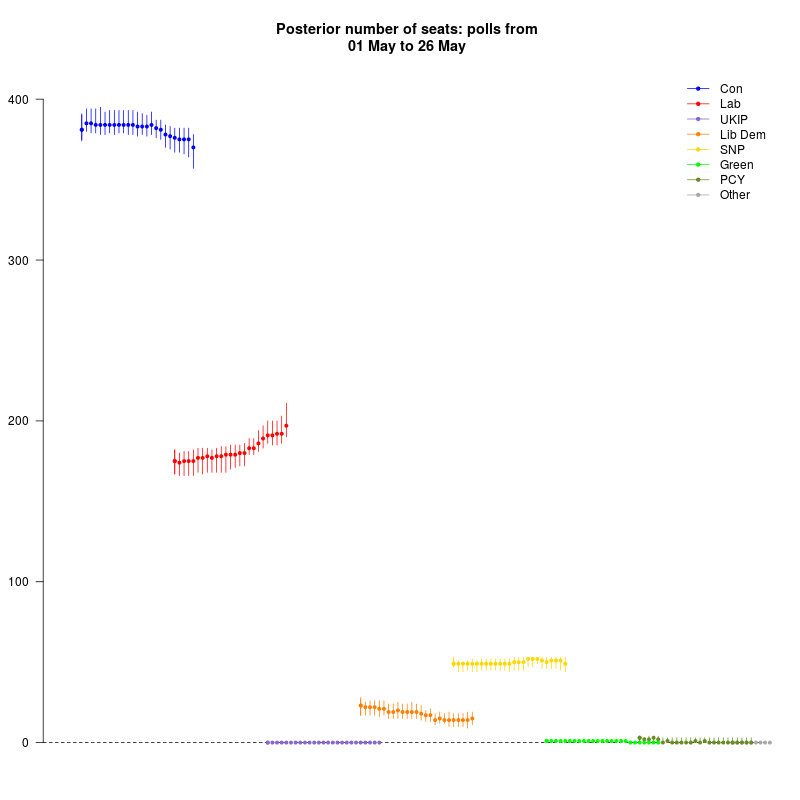
Labour has seen another little surge, and the Tories continue to lose a bit of ground. The Lib Dems are picking up again, it seems. But overall, the story is much the same – the Tories are still comfortably in the lead.
| Party | Mean | SD | 2.5% | Median | 97.5% |
| Conservative | 369.251 | 5.1765622 | 357 | 370 | 378.000 |
| Labour | 197.886 | 5.2142298 | 190 | 197 | 211.000 |
| SNP | 49.263 | 2.3965756 | 44 | 49 | 53.000 |
| Liberal Democrats | 15.085 | 2.3852598 | 11 | 15 | 19.025 |
| Plaid Cymru | 0.515 | 0.8499985 | 0 | 0 | 3.000 |
| UKIP | 0.000 | 0.0000000 | 0 | 0 | 0.000 |
| Green | 0.000 | 0.0000000 | 0 | 0 | 0.000 |
| Other | 0.000 | 0.0000000 | 0 | 0 | 0.000 |
About the author
Gianluca Baio is a reader in statistics and health economics within the Department of Statistical Sciences at University College London, and a member of the Significance editorial board.
This article is based on a series of blog posts, published at gianlubaio.blogspot.co.uk.


