In 2016, Queen Elizabeth II entered the tenth decade of her life and cemented her position as the longest-reigning British monarch, with 65 years on the throne. Many of us will have enjoyed the festivities of her 90th birthday, but as a statistician there was more to the occasion than a cause for celebration. Instead, I wanted to use this landmark moment to explain an area of statistics that is well-suited to the study of Queen Elizabeth’s reign: extreme value theory (EVT).
EVT is a relatively young branch of statistics, first formally introduced by Leonard Tippett in the mid-twentieth century. What first began as research aimed at making cotton thread more durable, has since spread into a vast number of applications – from meteorology and civil engineering, to computer security and the financial world. EVT deviates from the usual statistical ideas of ‘bell curves’, and means and medians of data, and focuses more on what happens at the tails of a distribution, where we find the probabilities of very unlikely events. Compared to the standard techniques used, EVT is advantageous in not treating these extreme values as outliers. Moreover, we are not obliged to assume that the data follow a particular distribution, and the process driving the data need not necessarily be known.
Here, I will present and illustrate EVT with regards to the reign duration of notable monarchs in history, which is a perfectly valid application. Specifically, I want to work out whether the length of the reign of Queen Elizabeth II is extreme when compared with the historical record, and how long it might be before another monarch is able to match or exceed her period of rule.
As with any piece of analysis, we must first specify our source of information. In this case I decided to pick open-access data from the Metropolitan Museum of Art, which contains a list of rulers from the Ancient World to present day, 2700 BC to 2016 AD.1
In order for EVT to be an acceptable application, we require the random variables of reign duration to be independent and identically distributed, which means that the occurrence of one event does not influence the probability of the next event, and that events follow the same distribution.
Of course, we may argue that this is not always the case, as one monarch’s political strategy could lead their successor to experience a shorter reign. Also, reign duration often has a direct link with life expectancy, which varied with times of conflict and quality of life. But it may be reasonable to treat this as a constant risk faced by all the monarchs in our data set, and I will discuss this in more detail later. The independence assumption is nevertheless important and is also frequently questioned in other areas of EVT, especially where further extreme events follow a primary extreme event, as in the case of earthquake aftershocks or financial crises.
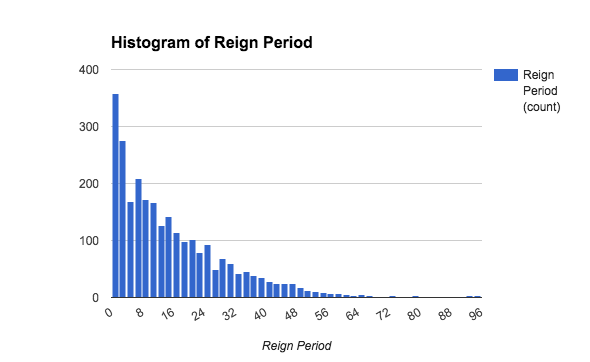
Next, we’ll consider the data itself. From summary statistics, I calculated the average overall reign period to be just over 14 years, with a maximum of 94 years. The reign of Elizabeth II has surpassed over 99.7% of monarchs under consideration and is challenged by only seven others. On average, Ancient Sudan had the highest average reign period of over 25 years, with the Roman Empire lowest at an average of eight years – which also happens to be Sudan’s minimum reign period. With regards to maximum values, it is a ruler from Ancient Egypt and Nubia that holds the record of 94 years, and all regions except Ancient Sudan had leaders who were succeeded less than a year after assuming power. From the distribution below we see a shape resembling exponential decay. The right-hand tail, which represents reign duration of over 70 years and is the focus of our interest, has few values present there.
Having carried out some descriptive analysis of the data, we can turn to EVT to derive further insight. There exist two main approaches to EVT: one considers the maximum values observed in a given period of time, and the other uses a set threshold value in order to estimate the distribution of those conditional excesses above the threshold. The choice of approach often depends on the data set at hand: if we were given the longest-reigning monarch in each century, we would be restricted to using the first ‘block maxima’ approach. However, with all data at hand, I thought it would be interesting to use the second approach, known as ‘peak over threshold’ (POT) to see which length of reign can be seen as ‘extreme’, given the data.
These extreme events, or ‘excesses’, can be approximated by the Generalised Pareto Distribution (GPD). A link between POT and GPD was made in the 1970s, and – like many standard distributions – GPD contains shape, scale and location parameters. In order to find the distribution of excesses in our data set we are faced with the task of choosing the appropriate threshold value u, above which reign durations can be viewed as extreme. At first, this may seem a subjective exercise, but as statisticians we have a tool we can apply. A residual life plot (below) comes in handy to help us select the threshold value.

The plot above shows the threshold u against the mean excess – that is (mean of excesses of u) − u. The GPD model becomes reasonable at the point above which the plot becomes linear. In this example, we see the appropriate value is around 46. There are seventy-two excesses above the threshold, which is a suitable amount given the size of our data set. Using these values to estimate the model, we are led to the following estimates and their standard errors:
- Scale estimate: 8.97612; standard error: 1.4044
- Shape estimate: 0.00111; standard error: 0.1029
I have further compared these estimates with a threshold of 50 years, and the former provided a better fit with regards to standard errors. From our threshold value, the probability of exceeding the reign period of 46 years is shown to be 72/2569 = 2.8%, and we call this value λu. We see that the shape parameter is very close to zero but it is still positive – this indicates that the raw data are more heavy tailed than I first suspected. When the shape parameter is zero, GPD is reduced to the exponential distribution and when it is 1, we obtain the continuous uniform distribution. If we construct a confidence interval for our shape parameter value, it does indeed contain zero (−0.2005834, 0.2028031). So it would not be unjustified to state that the excesses follow an exponential distribution.
With this information, we may attempt to look into the future and ask when we might see another long-reigning monarch? We can try to predict this via a return level formula, and we see that in the next 100 years we can expect to see a reign of length 55.25 years. The following table contains the reign lengths exceeded on average once every m years, given our past data and the parameter estimates.
| m (years) | Maximum expected reign |
| 50 | 49.02 |
| 100 | 55.25 |
| 150 | 58.89 |
| 200 | 61.48 |
| 250 | 63.49 |
| 300 | 65.13 |
We must be careful not to interpret these figures too literally, as they rely on reign times having a similar driving force behind them, which is not always true. Rising life expectancy and royal families not being as commonplace as before means that future monarchs may individually and collectively reign for a shorter period of time, but live longer than their ancestors. So far, the model we have looked at worked under the underlying assumption of the observations being stationary, which in simple terms means that the reign times have similar characteristics (and follow a similar distribution), whether a ruler lived 4000 years ago or is alive today – there is no dependence on time or any other trend. However, if we look closer at the data, we may wonder if there is any dependence of reign duration on the time period, or age at coronation. Similarly, we may consider factors such as life expectancy and quality of life as important. To incorporate these new ideas into our model, we have to make the scale and shape estimates dependent on some variable.
Earlier, we saw that the shape parameter was not significantly different from zero, which leads to reign ‘excess’ times following an exponential pattern. The shape parameter is seldom modelled as a function of time or any other parameter, so from now on we will concentrate on the scale function for the data and build it as a function of some covariates, which will represent the factors that may influence length of reign.
A natural first choice for these covariates is the age at which a monarch assumes power, as it is more likely that someone starting their reign at a young age will live and reign for longer than someone starting decades later in life, assuming they die a natural death. To use this in our model, we would need the year of birth for every monarch in our data set, but this is difficult to accomplish, especially for rulers of the Ancient World, due to missing historical data. Therefore, for this part of the analysis, I have chosen to concentrate on data only from Europe (391 AD to 2016 AD), as it makes up the largest sub-sample – just over a third of the total sample size – and includes Queen Elizabeth II and her ancestors.
In this sub-sample, the longest reign period is 72 years, the mean is 17.1 years and Queen Elizabeth II falls within the top-five longest-ruling European monarchs. Carrying out a similar analysis to earlier and assuming stationarity (for the moment), we find that a threshold of 40 years is reasonable for a GPD model of European data with the scale and shape parameter estimates as 13.338 and -0.3402, respectively. Here, we have a negative shape parameter, implying a Beta type distribution, with an upper bound in the tail of 79 years.
Now we have to concentrate on possible covariates to include in our model. Age at coronation is the most simple and, for this sub-sample, can be easily quantified. The other covariate that could be considered is life expectancy, but it turns out that figures for this measure are very similar up until the last 100 years. The same goes for measures relating to quality of life/medical advances – though one might argue that since monarchs are a very select group of people within the general population, they would have had access to the best care and medicine available at the time. But this factor is also very difficult to quantify, let alone capture.
If we produce a plot comparing year of birth of every European monarch and their reign period (see below), we see no significant trend with the correlation being very weak – under 6%. I have also considered correlations for those who reigned for over 40 years and their birth year – it is again weak, at just under 8%. Conversely, we can argue for the inclusion of this variable by considering the mean length of reign and the year of birth of each monarch, and compare the historical data. We find that from the 17th Century onwards, the mean reign period has been over 18 years, reaching 20 years for those born last century, even though the latter group is the smallest. However, in the 12th and 14th Centuries, there was also a high mean reign period of over 19 years; for the remaining time periods, it is between 14 and 16 years. The picture is not made any clearer with the correlation coefficient at a moderate positive 55%, which indicates some relationship between the variables but it is not so linear as to be conclusive. We must also keep in mind that not every monarch’s date of birth is known, so we may be missing some data which may influence our conclusions.

But if we were to include age at start of reign as a covariate, we can think of the scale parameter as a function of age. From this we can work out the return level for a monarch who assumes power at the age of 25, which is the same age at which Elizabeth of House Windsor became Queen Elizabeth II. Here, our scale parameter estimate will be 11.4084, and in the next century we can expect a reign of a maximum length of 55.71 years, given the estimated parameters. We may therefore be waiting a long time for another monarch to equal Queen Elizabeth II’s record.
About the author
Anastasia Frantsuzova obtained her undergraduate degree in Mathematics with Statistics at City University London, and is currently studying for an M.Sc. in Statistics at the University of St Andrews. She was a finalist in the 2016 Young Statisticians Writing Competition, and presented a paper based on this article at the 2016 RSS Conference in Manchester.
Footnote
- This list must not be viewed as fully complete. For example, it is lacking certain regions, focuses on more influential dynasties in the world of art and omits rulers of smaller states. Having investigated other sources of data, however, I found this to be the most official and reconcilable of all. I hesitated to merge lists together not only due to concerns about the reliability of data, but also to avoid duplicates where the same rulers may be recorded under different names. I shall commit to the source above, as it is a sufficiently large sample for the purposes of modelling. I decided to focus specifically on the type of rule that is passed from a predecessor to a successor in the case of death or abdication, and not elected rulers with a set time of leadership. ^


