
Only a few years ago, the eye-watering price of fuel led me to try all kinds of efficiency wheezes in an effort to make a tank last longer. I even considered converting my diesel engine to run on vegetable oil and making friends with the proprietor of a fried chicken shop.
But while the fall seems incredible from the vantage point of the 2012 spike, it’s interesting to see how today’s prices are more or less a return to the historical average.
Petrol (as we say in the UK)
First, let’s take a look at the UK’s petrol price per litre (inflation adjusted), from 1903 to 20141.
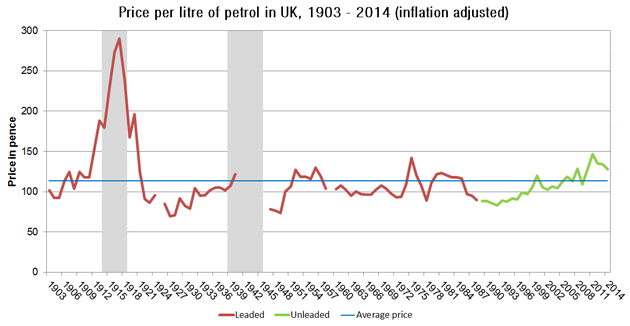
The shaded areas mark the two world wars.
The first thing that strikes you in this chart is the huge spike during the First World War. It demonstrates how fuel imports were being squeezed by the war, but with so few cars on the road at the time this would have only affected certain industries and parts of the war effort.
The average price of a litre over the 111 years is £1.13. From the end of the First World War to the start of the new millennium, the cost only rose above this level in four periods – during the Second World War, the mid-fifties (due to the Suez crisis) and the mid to late-seventies (in the aftermath of the Yom Kippur War and the Iranian revolution.)
Since then, there have been a couple of mini spikes, but only in 2011-12 did the relative cost of petrol exceed levels last seen in the grim mid-seventies.
Gasoline (as they say in the USA)
The most reliable data for the US unfortunately only begins in 19492. But it does show how the oil shocks of the mid-seventies had a huge effect on the price at the pumps.

Things then settle down until the mid-noughties, when prices start to rise and eventually breach the $3.50 per gallon mark. The average historical price (based on the data available) is $1.83 a gallon. At the time of writing, you can find gas below this level in Missouri, Oklahoma and Kansas.
What’s behind the current prices?
The fluctuations in prices at the pump are mostly down to how much a barrel of oil is trading at on the world markets. One explanation for the current slump is supply and demand. Since the price peaked in the last few years, Canada and the US have been ramping up oil production. Meanwhile, the global economic malaise that followed the financial crash of 2008 is still with us, and with it low levels of growth.
The more intriguing answer is geopolitics, the kind that caused the price spikes of the fifties and seventies. Low prices hurt the oil producing countries, but despite this Saudi Arabia refuses to cut production.
The Saudis are playing multiple strategic games – firstly a low oil price hurts their old enemies, the Iranians. Secondly it hurts the Russians, who are supporting the Saudis foes in the Syrian regime in Damascus. Thirdly, the increase in US and Canadian oil production has reduced their reliance on unstable foreign imports. But this oil is expensive to extract and sustained low prices will send many oil operations to the wall.
A former Saudi adviser recently told the BBC that the kingdom could endure eight years with these low prices. In the meantime, the other oil producing nations of the world would suffer significant problems of the kind an absolute monarchy doesn’t have to worry about.
As far as powering a car is concerned, these global commodity games are a bit 20th century. Motorists will hopefully soon leave barrels of oil behind when the exciting advances in battery technology eventually make it into showrooms.
Footnotes
- 1. Data for the UK is taken from the AA until 1977 (converted from gallons to litres and new money prior to decimalisation in 1971), a few years of data are missing from the source. From then on Department of Energy & Climate Change (DECC) statistics are then used. DECC records unleaded petrol price from 1989 onwards. From this point on most new vehicles ran on unleaded so I have used these figures. Inflation multipliers are taken from here, and are based on the Retail Price Index (RPI) which has just been recommended for the scrapheap by an official review. As a result, all these are estimates, created using the most reliable available data.
- 2. Data for the USA is slightly easier, as the US Energy Information Administration (EIA) has recorded the price of regular leaded and unleaded from 1949 to 2011 with inflation adjusted. 2011 to 2014 data taken from current EIA releases.


