
In our December 2018 print edition, Jeff Ralph, the Royal Statistical Society’s William Guy schools’ lecturer for the 2017-18 academic year, explains how times have changed for teenagers, as told through official statistics. The print article tackles the subjects of life expectancy, household income, household expenditure and inflation. In this web-exclusive piece, Ralph explains how baby names have changed over the past hundred years, and how the number of undergraduate degrees awarded have gone up and up.
Baby names
Each year, the most popular first names given to babies born in England and Wales are published by the Office for National Statistics. In Scotland they are published by National Records of Scotland and in Northern Ireland by the Northern Ireland Statistics and Research Agency. These statistics are always prominent items in news bulletins. Table 1 shows the top five names for births in the year 2000.
TABLE 1 Most popular first names, births in the year 2000.
| Girls | Boys | ||||||
| England and Wales |
Scotland | Northern Ireland | England and Wales |
Scotland | Northern Ireland | ||
| Chloe | Chloe | Chloe | Jack | Jack | Matthew | ||
| Emily | Amy | Emma | Thomas | Lewis | Jack | ||
| Megan | Lauren | Caitlin | James | Ryan | Ryan | ||
| Jessica | Emma | Megan | Joshua | Cameron | James | ||
| Charlotte | Rebecca | Rebecca | Daniel | James | Adam | ||
The popular press will usually report just the names. While I enjoy seeing these top names each year, as a statistician I like to know a bit more. For example, how many babies were born in that year and how many were given the name Chloe? A more comprehensive picture is provided by the official statistics publications. Official statistics usually come as a statistical bulletin with accompanying data files and further information on how the statistics have been prepared.
The statistical outputs on births and baby names for the year 2000 for England and Wales tell us that 604,441 live births were registered, of which 309,625 (51.2%) were boys and 294,816 (48.8%) were girls. The numbers for the top two first names are shown in Table 2.
TABLE 2 Counts and percentages of the top two baby names for births in the year 2000, England and Wales.
| Girls | Boys | |||
| Chloe | 7,534 (2.6%) | Jack | 9,079 (2.9%) | |
| Emily | 6,232 (2.1%) | Thomas | 8,672 (2.8%) | |
From these numbers, we see that even the most popular boys’ and girls’ names were given to fewer than 3% of babies in 2000 – this suggests that there were very many names applied. The official data confirms this – there were 3,931 different boys’ names and 5,154 distinct girls’ names given at least three times.
Another aspect of a statistic that is important to a statistician is to understand why the data are collected, how they are collected and the purposes to which they are put. In England and Wales, it is a legal requirement for live births to be registered within 42 days. This civil registration is an important activity, is carried out by a registrar, and can take place in either a hospital or a local Register Office. The registrar enters data into a computer application, the Registration Online System. Data input includes the name and a variety of other information; a birth certificate is then issued. The birth certificate is an important element in the process to obtain a passport and a school place. The baby names statistics are produced from the registration process and used by parents and soon-to-be parents as well as being of general public interest.
How have the popular names changed over the past century or so? We can look to official records to find the most popular first names in 1900 and see how their popularity has changed in the years 2000 and 2016. This is shown in Table 3 for England and Wales.
TABLE 3 Top five first names for births in the year 1900 and their positions in the years 2000 and 2016, England and Wales.
| Girls | Boys | |||||||
| 1900 | 2000 | 2016 | 1900 | 2000 | 2016 | |||
| Mary | 1 | 146 | 250 | William | 1 | 12 | 11 | |
| Florence | 2 | 163 | 20 | John | 2 | 58 | 120 | |
| Annie | 3 | 128 | 108 | George | 3 | 17 | 3 | |
| Edith | 4 | 930 | 101 | Thomas | 4 | 2 | 9 | |
| Alice | 5 | 29 | 17 | James | 5 | 3 | 12 | |
We can see that for girls, the most popular first names from 1900 are no longer so popular now, with the exception of Alice. However, most have improved their popularity since 2000, particularly Florence and Edith. For boys, the situation is rather different, with the most popular names from 1900 retaining their popularity, with the exception of John.
A variety of possible explanations have been put forward for the changes in popularity of particular names. The first names of our grandparents are often used as middle names for our children, and this helps to keep traditional names familiar. The choice of names for royal babies has an effect, too; for example, there was an increase in babies named Elizabeth in England and Wales in the early 1950s.
Undergraduate degrees
School students in the first year of their sixth form have important choices to make, including whether to go to university and, if so, where to go and what subject to study. We are approaching a position in the UK where almost half of school students go to university; they have a wide range of institutions and subjects to choose from. What can official statistics tell us about the situation a hundred years ago, and what changes in society have led us to the current situation?
Historical statistics record the number of undergraduate or first degrees awarded over time. Figure 1 shows the number of first degrees awarded from 1920 to 2011 for the UK; it reveals a dramatic growth.
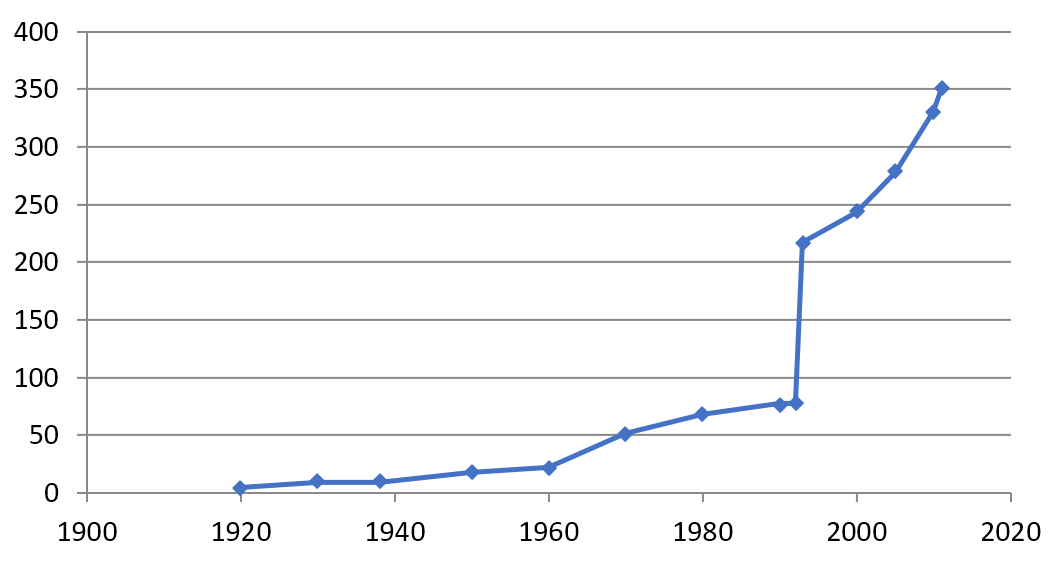
FIGURE 1 The number of first degrees awarded, UK, 1920–2011.
In the early decades of the twentieth century, very few young people went to university, and little changed up to the Second World War. After the war, the number of degrees awarded increased as a result of government schemes to support people returning from military service. The 1960s saw a more rapid increase. Governments of the time presided over an expansion of higher education to address concerns that the UK might fall behind other nations without a greater number of young people educated to degree level. Many new universities were built in the 1960s, including Warwick University, where I studied maths and physics between 1977 and 1984.
Before the 1990s, the post-school education sector included polytechnics and universities, with polytechnics concentrating more on practical and applied courses. In the early 1990s, the government decided to remove the distinction and polytechnics became universities; this led to a near doubling of the number of universities and hence a dramatic increase in the number of university degrees awarded.
Clearly, the opportunities for post-school education are much greater now than a century ago. However, there is another aspect of change that is even more striking. Figure 2 separates the degree numbers by men and women. We see that very few women obtained degrees before 1960. Since then the numbers have increased, so that degrees awarded to women exceed those awarded to men.
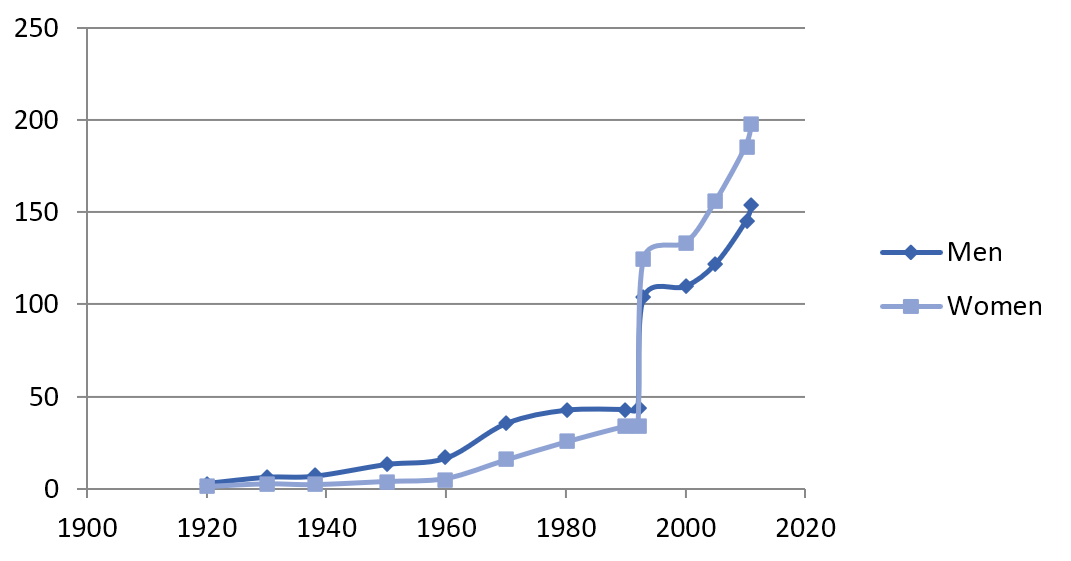
FIGURE 2 The number of degrees awarded by sex, UK, 1920–2011.
Questions, questions, questions
The statistics above, and those published as part of my print magazine article, are extracts from my William Guy schools’ talk for 2017–18. However, there was another important part of all the talks: the questions. Over the course of 10 talks, the audiences asked a very large number of questions both during and at the end of each talk. Several topics arose multiple times, and in this section, I discuss two of the most popular:
- Why should we believe the statistics we read, and how can we tell whether a statistic is accurate or not?
We certainlty should take a cautious view of what we read – not all statistical information is of high quality. But there are some common approaches to the production of quality official statistics that we can check for. These include the following:
- International standards have evolved based on many expert opinions, and most official statistics are produced to these standards.
- How the statistics are produced – that is, the methodology behind each official statistic – is published and is available for anyone to examine and question.
- Communication with academic experts and the wider users of statistics helps to ensure that the statistics are continuously scrutinised and evolve to meet changing needs.
- Each statistic is independent assessed by experts and recommendations are made for improvements; this is repeated every few years.
It takes a lot of effort to produce high-quality statistics, especially for quantities that are hard to measure, such as economic growth, the extent of poverty and the level of inflation.
- Can we use the digital data we generate from our increasing online activity to produce useful statistics?
The short answer is yes, and it is a major research and development area for statistics. Both the types of data and the large volumes present challenges to the statistician; new ways of handling and processing these data are required. For example, the availability of price data from shop websites can help with investigating overall price changes for use in economic statistics. This emerging area of analysing massive, high-frequency data sets is where young people just out of university with good analytical and computing skills are making an impact. A wide range of organisations, including financial institutions, energy companies and the Civil Service, will be recruiting many more analytical graduates for this work in future.
About the author
Jeff Ralph worked for the UK Office for National Statistics for 14 years, retiring in March 2018. He is currently a visiting scholar at the Statistical Sciences Research Institute at the University of Southampton.


