Surname distributions are increasingly used in geography, for example, to characterise cultural regions.1 There are, however, few studies analysing the associations between surname distributions and voting patterns.2 This is what we set out to do here, using data on surnames and locations from the 2001 UK electoral register and the results of the EU membership referendum.
The data sets
Readers may be wondering why our surname data is 15 years old, but there is a good reason. Prior to 2001, the UK electoral register contained the names and address of all people registered to vote in UK elections. In 2001 a change in the law allowed voters to “opt out” of the publicly available version of the electoral register. This had an effect on the completeness of the data set as the level of “opt out” for 2007 was estimated at 30%.3
The 2001 electoral register is therefore the last version of the electoral register before “opting out” was possible and is, to our knowledge, the best source of names and locations publicly available. For this article, we used the “enhanced” register, which was supplemented with details of people not registered to vote. An analysis of this data set appeared in Significance back in 2008.4 The enhanced register contains surnames (but no personal names) of 45.6 million people who were resident in the UK in October 2001, sorted according to 434 administrative districts.
The analyses in this article, however, are based on the 372 (out of 399) voting areas that we could directly match to one of these 434 administrative districts. Unfortunately, we were unable to link voting areas in Northern Ireland and Cornwall, for example.
Methods
Although surname diversity has been used as a proxy for ethnic heterogeneity by some authors,5 we do not advocate this approach here, restricting our attention to surname diversity itself (though, as the surname database with which we worked is 15 years old, there may be a bias towards underestimating surname variability).
We summarised surname frequencies using measures first developed to study vocabulary richness, as distributions of vocabularies and collections of surnames have many similar features: for instance (i) their minimum occurrence value is 1, corresponding to words which appear once in a text and to surnames which appear uniquely in the population; (ii) values in the upper occurrence tail correspond to words appearing very often (e.g. “and”, “the”) and to most frequent surnames (e.g. Smith). Such statistics are studied by Tweedie and Baayen, for example.6 Based on the results from the 2008 Significance article,4 we choose to restrict our attention to the percentage of people with surnames that occur uniquely in a district; we call this variable HL, after the term hapax legomena, which is used in vocabulary distributions to denote words appearing uniquely in a text. Higher values of HL indicate an increased number of unique surnames and therefore a higher surname diversity in the population.
Results
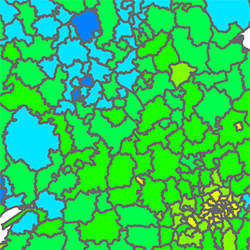
Figure 1 maps HL for the 434 UK administrative districts (as per the October 2001 electoral register). The map shows, for example, that Northern Ireland, South Wales, parts of Yorkshire and Humberside, and much of Scotland stand out for having more districts with lower percentages of people with unique surnames; conversely, the Scilly Isles, Oxford and Cambridge, and most of Central London are the most heterogeneous districts in the UK.

Figure 1. Map of the percentage of people with unique surnames in UK administrative districts. Greater London districts are shown separately in the top left corner
Regarding the EU referendum voting areas, in Scotland the Leave vote was under 50% in all districts, while in large parts of England (excluding London) and Wales the majority of voters opted for Leave. Analyses published by The Guardian and by YouGov, and discussed further in The Conversation, indicate that the “lowest [proportions of] Leave votes were mainly in urban areas with high non UK-born populations, in London boroughs and several university cities”, and that “high proportions of Leave votes were observed in districts with an older age profile, lower proportions of residents educated to the equivalent of a degree, lower median earnings and lower proportions employed in highly skilled occupations”.
In Figure 2, we plot the percentage voting Leave against the percentage of people with unique surnames for each of the 372 matching administrative districts in England, Scotland and Wales.

Figure 2. The association of the percentage voting Leave to the percentage of people with unique surnames for England, Scotland and Wales
The fact that Scotland favoured Remain, while large parts of England and Wales supported Leave, can clearly be seen. We modelled the percentage of Leave voters as a smooth function of the percentage of people with unique surnames using a different logistic regression model for each country. The yellow lines represent fitted values from the models. We observe that generally, as the percentage of unique surnames increases, indicating higher surname heterogeneity within a district, the percentage of voters who opted for Leave decreases. This effect is less strong in Scotland than in the other two countries, possibly due to the generally strong Remain feeling there.
Next, we looked at the association between HL and the Leave vote percentage in nine administrative regions of England, as well as the other three UK countries (see Figure 3). Note that these regional and national data include results for both variables from districts that could not be matched for the analyses presented in Figure 2.

Figure 3. Percentage of Leave voters against percentage of people with unique surnames by regions of England and the other UK countries
The division between London and the rest of England on both surname heterogeneity and Leave votes is striking: for instance, London has over three times more surname diversity than Yorkshire and the Humber (3.6 times), the North East (3.4), the North West (3.2), Wales (3.1) and the West Midlands (3.1), and around twice the surname diversity of the South West (2.2), the South East (1.8) and the East of England (2.0).
Comparing the Leave vote in London to the English regions and Wales, we see that it was between 29% (South East) and 48% (West Midlands) higher outside the capital. Scotland and Northern Ireland have a completely different voting pattern, as they are much closer to London in their percentages of Leave votes, while London has four-to-five times more surname diversity than Scotland and Northern Ireland. The separations between regions shown in Figure 3 underscore the fact that people in different parts of the country had different reasons for voting the way they did. In London, it was about multiculturalism and cosmopolitanism; in Scotland, it was nationalism within Europe, rather than within the UK; Northern Ireland's reasons are too complex to be summarised here; and for those who voted Leave elsewhere in the UK, this reflected a resentment towards London-centric policies, feelings of job-insecurity, and anti-immigration sentiment.
Most frequent surnames
In measuring surname diversity (using HL) we counted up the number of people with unique surnames in a given area. But, in looking at the distribution of surnames across these areas, we saw a long tail of frequently appearing names.
For each administrative district that matched a voting area, we found the 10 most common surnames and identified the most popular among all these surnames over Leave and Remain voting areas. The percentage of the total number of surnames accounted for by each name is given in Table 1, up to a cumulative total of approximately 50%. Although the most popular six surnames are common to both Leave and Remain areas, we see that only seven names account for 50% of all surnames in Leave areas; in Remain areas, nine names account for the same proportion. Again, this suggests a lower surname diversity in Leave districts.
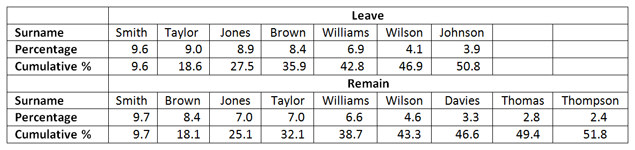
Table 1. The percentage of surname occurrences among the ten most popular surnames across matched Leave/Remain voting areas
Discussion
Our analyses follow the approach of Cheshire and Longley, who emphasised the importance of analysing historic and contemporary surname databases to study “population characteristics, and the long and short term dynamics that characterise population change”.7
We have seen that the percentage of voters opting for Leave shows some dependence on measures of surname diversity, such as the percentage of people with surnames occurring only once. This suggests that if political strategists on both the Remain and Leave sides had considered surname diversity, they would have had a better idea of where to concentrate their campaign efforts.
This conclusion must be regarded tentatively as our analyses have several drawbacks. First, the surname data used to calculate the surname diversity data is 15 years old and so there may be a bias towards underestimating surname variability, especially perhaps in areas that may have had higher levels of immigration. However, a comparison between the top 10 surnames from the 1881 census and the 2001 electoral register data showed few changes,4 and a permanency of the top UK surnames across centuries was also found by Tucker, indicating that any bias coming from underestimating surname variability may be small.8 Secondly, the matching between previous administrative districts and 2016 voting areas is not precise and may therefore be a source of additional bias.
Nevertheless, our results show how looking at surname distributions can add useful and data-driven insights to political analyses and thinking. We therefore suggest that further use should be made of them in future policy-making.
- Mario Cortina Borja is chairman of the Significance editorial board, and professor of biostatistics in the Population Policy and Practice Programme, Institute of Child Health, University College London. Julian Stander is associate professor (reader) in mathematics and statistics in the School of Computing, Electronics and Mathematics, Plymouth University. Luciana Dalla Valle is a lecturer in statistics in the School of Computing, Electronics and Mathematics, Plymouth University.
References
- Mateos, P. (2014) Names, Ethnicity and Populations: Tracing Identity in Space. Springer, Heidelberg. ^
- Cantú, F. (2013) Identifying irregularities in Mexican local elections. American Journal of Political Science, 58, 936-951. ^
- Equifax (2007) ER voter opt-out hits record levels. Data Strategy, 7(6). ^
- McElduff F., Mateos P., Wade A. and Cortina Borja M. (2008) What’s in a name? The frequency and geographic distributions of UK surnames. Significance, 5, 189-192. ^
- Lauderdale, D.S. and Kestenbaum B. (2000) Asian American ethnic identification by surname. Population Research and Policy Review, 19, 283-300. ^
- Tweedie, F. J. and Baayen, R. H. (1998) How variable may a constant be? Measures of lexical richness in perspective. Computers and the Humanities, 32, 323-352. ^
- Cheshire, J. and Longley, P. (2011) Spatial concentrations of surnames in Great Britain. Procedia-Social and Behavioral Sciences, 21, 279-286. ^
- Tucker, D. K. (2004) The forenames and surnames from the GB 1998 Electoral Roll compared with those from the UK 1881 Census. Nomina, 27, 5–40. ^


