
Italy was the first European country to suffer a severe outbreak of Covid-19. The first cases were reported on 21 February. Daily confirmed cases, hospitalizations and deaths grew very fast from that point, until they peaked during the first days of April. In order to slow the spread of the epidemic, the Italian government placed a variety of restrictions on the public, culminating in a complete lockdown that lasted until 4 May.
The end of the lockdown marked the end of “phase one” of the government’s response. “Phase two” saw a gradual easing of the previously imposed restrictive measures, as well as the introduction of a contact tracing system, to detect and confine in a timely manner small and moderate outbreaks arising all over the country. Writing about Italy’s response to the pandemic, the New York Times said in July that “the country has gone from being a global pariah to a model – however imperfect – of viral containment”.
The benefits of contact tracing have been seen in a two-stage survey conducted in the municipality of Vò, a small town in Veneto in north-eastern Italy, which took place 21-29 February and 7 March. The diagnosis of a large rate of asymptomatic cases (above 40%) shed more light on the transmission dynamics of SARS-CoV-2, the virus that causes Covid-19. In particular, the authors did not find any evidence of difference in the viral loads recovered from nasopharyngeal swabs, nor significant differences in the distribution of asymptomatic infections between age groups.
Summer brought a renewed spread of Covid-19 in Italy and in other parts of the world. The larger mobility within and between countries, for vacation and tourism, combined with an easing of the previously imposed restrictive measures to allow a gradual return to normality and to support the economy, made cases start growing again – though growth in Italy was initially less alarming than in other European countries such as Spain, France and the UK. This was the outcome of all those policies that were successfully implemented: the lockdown during March and April, and the strict restrictions aimed at regulating social behaviors, transportation, sport events and other circumstances characterized by a risk of large gatherings.
Figure 1 displays the monthly average daily number of cases, hospitalizations, number of patients in intensive care units (ICU) and deaths in Italy, from March to September. The average number of cases is the result of a weighted mean accounting for the number of swab-tests conducted. From peaks in March/April time, each chart shows a decrease over time from May to July. By the end of July, hospitalizations and deaths had reduced more than half with respect to the previous months. Cases started growing again from August. This new increase led to a growth in the numbers of hospitalizations and ICU patients in September, but deaths at that time had not increased noticeably. The mortality of Covid-19 depends on the characteristics of the population hit by the disease. Age is a primary indicator of the presence of other comorbidities: among the subjects testing positive for Covid-19, the median age changed from 62 in March 2020 to 42 in the last week of September.
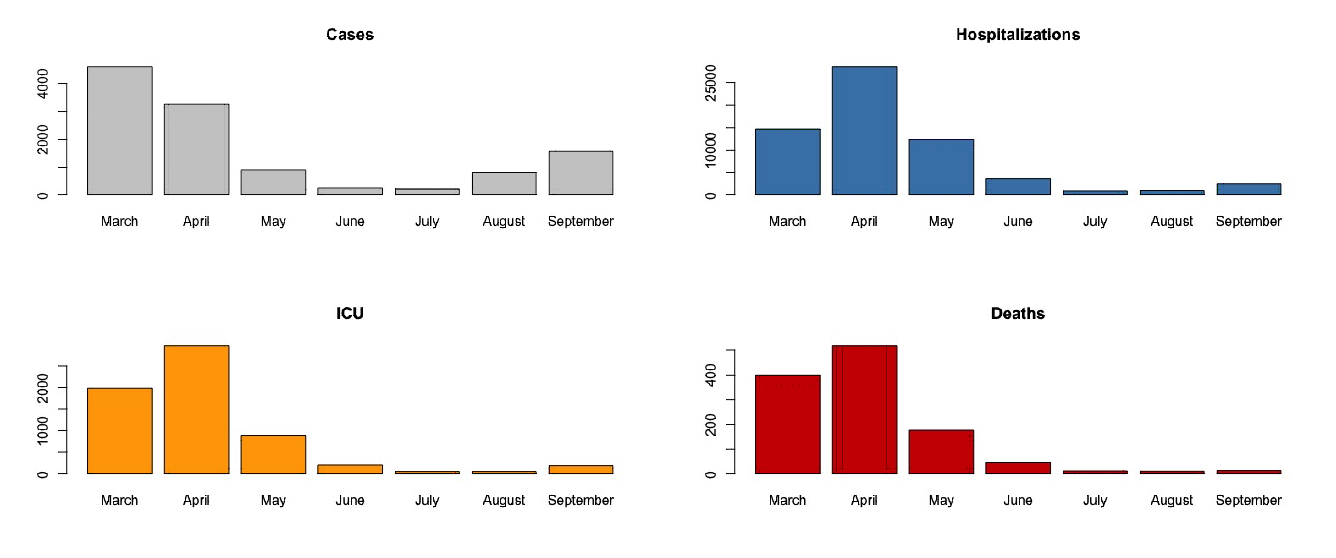
Figure 1: Average daily number of cases, hospitalizations, patients in intensive care units (ICU) and deaths in Italy from March to September.
The decreased pressure on the health system during summer allowed for a more effective diagnostic power. In fact, the number of performed tests during August and September was larger than the previous months, in particular March and April, as depicted in Figure 2. Furthermore, the number of diagnoses from screening also increased, as illustrated in Figure 3 (data about diagnoses of positive cases from screening are only available from 26 June).
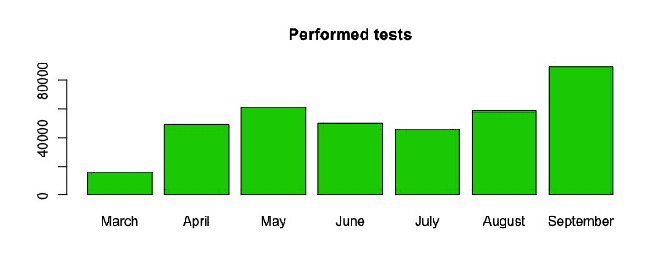
Figure 2: Average daily number of tests performed in Italy from March to September.
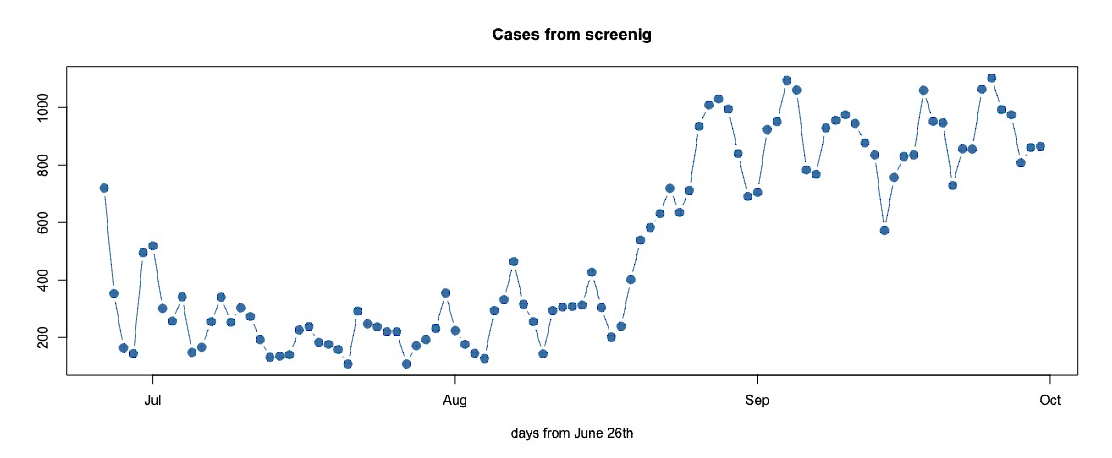
Figure 3: Daily number of cases from screening from 26 June to 30 September in Italy.
Figure 4 shows the daily number of new positive cases as a rolling weighted average over seven days. The curve had settled on a sort of endemic level during June and July, since a flat stretch characterizes its behavior over those months. The right tail, however, suggests the beginning of a second wave of infections, although growing at a slower rate than the first wave in March.
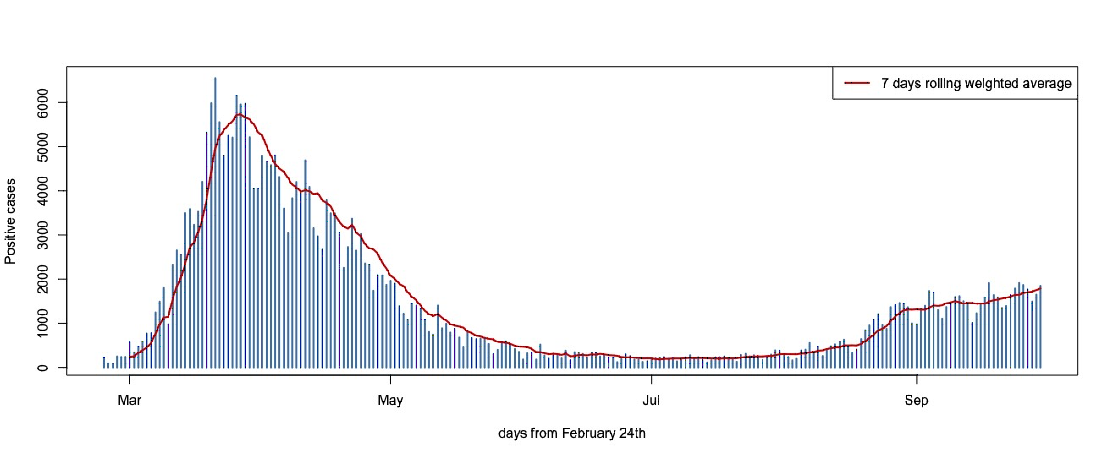
Figure 4: Daily positive cases from 24 February to 30 September in Italy.
In order to better understand this seemingly endemic behavior in June and July, and to monitor the growth of infections from August, let us consider the positivity rates over the number of tests, rather than focusing on the absolute numbers. The positivity rate is given by the share of tests returning a positive result. The official data provided by the Ministry of Health and compiled by the Department of Civil Protection report this share for both the number of tests performed and the number of tested individuals (from 24 April). The reason for the two numbers to differ is that an individual can be tested more than once. The positivity rate is a direct measure of the testing and surveillance capacity of the health system. A small rate means that the number of swabs is sufficiently large, so as to also include asymptomatic cases. On the contrary, large values mean that infected people are likely to escape testing and that the growth seen in confirmed cases is underestimated.
We model the observed number of daily cases using a negative binomial distribution, with expected value μ and dispersion parameter θ. This choice is motivated by the fact that we want to be cautious in catching the uncertainty characterizing such count data, with respect to the use of a Poisson model, for instance. The variance of a negative binomial random variable is μ + (μ2/θ). The Poisson case is recovered as θ → ∞. We assume that
μi/mi = eβ, i = 1, 2, … , 7
where mi denotes the number of administered swabs at the i-th time point.
Figure 5 gives maximum likelihood point estimates (red dots) of the weekly positivity rate eβ in 21 consecutive weeks, from 4 May to 27 September, and 95% likelihood-based confidence intervals (black dots connected by a dotted line). We considered the share of positive cases both on tests performed and individuals tested.
There is evidence of a reduction in the positivity rates with respect to the first three weeks of the period in question. The confidence intervals start overlapping from the fourth week, meaning that there is no longer evidence of a change in the spread of the contagion. However, the positivity rates start to increase from the 15th week (from 10 August). Looking specifically at the positivity rate evaluated over tested individuals, we see it drop from 4.5%, 2.5% and 1.7% in the first three weeks of May, at the beginning of phase two, to an average 1% in the following 11 weeks. However, the average positivity rate in the final four weeks is 2.65%. According to recommendations from the World Health Organization, the positivity rate should remain below 3-5% as a general benchmark of adequate testing.
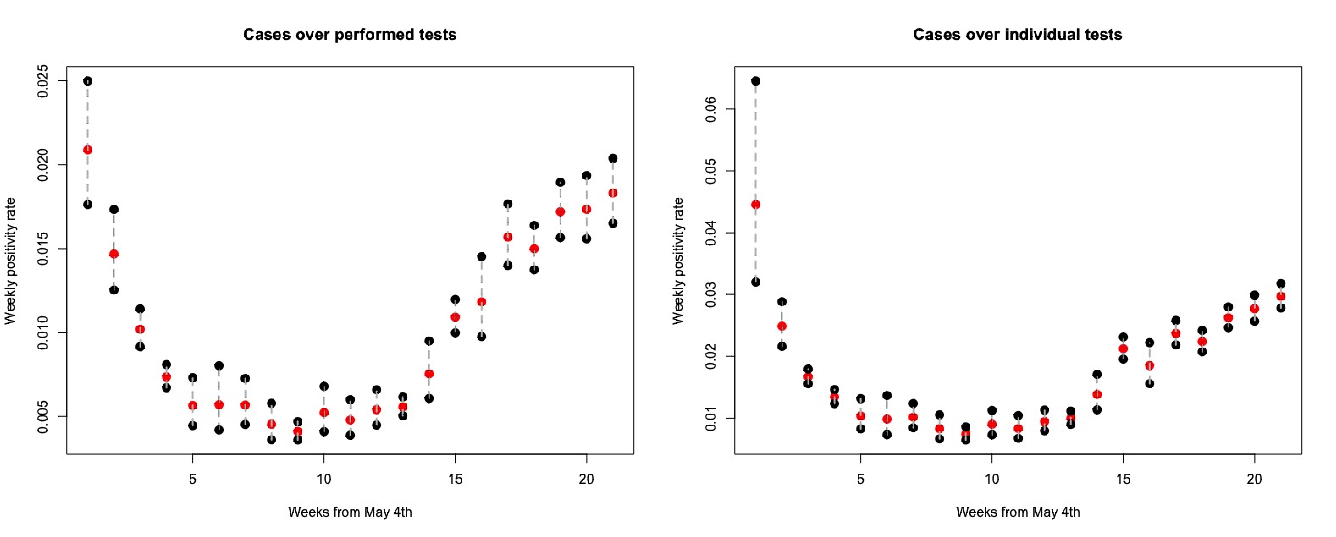
Figure 5: Weekly positive rates over the number of swabs (left) and tested individuals (right) from 4 May to 27 September in Italy, with 95% confidence intervals.
Conclusions
The flatness of the curve in Figures 4 and 5 during June and July is a sign that circulation of SARS-CoV-2 was ongoing despite the small number of cases at the time, and that neither contact tracing nor anti-contagion recommendations should have been relaxed further. Nevertheless, summer mobility and the gradual easing of previously imposed restrictions led to a new increase in the number of diagnosed cases.
Positivity rates were at a fairly satisfactory level during the weeks in which a second wave of contagion hit Italy. At that time, we could still claim that the Covid-19 outbreak in Italy was in check and that the spread of the disease had been to some extent contained. This claim can be reinforced by looking at comparable data for other European countries. Figure 6 compares the Italian situation with the situations in Spain, France, Germany and the UK to the end of September. The data can be downloaded from Our World in Data. Spain, France and the UK were experiencing a larger number of cases than Italy and Germany, and the situation in Spain and France was pretty alarming. In particular, the very large growth in positivity rates suggests that the virus was spreading faster than the growth seen in confirmed cases, and that there was a need for more action and contact tracing to constrain the outbreak.
The Italian government seems determined not to relax its attention and continues to press for rules to be respected, as confirmed by the extension of the state of emergency until 15 October and the very recent intent to extend it until 31 January. This is a clear sign of preparedness and could be an important action as we move into winter.
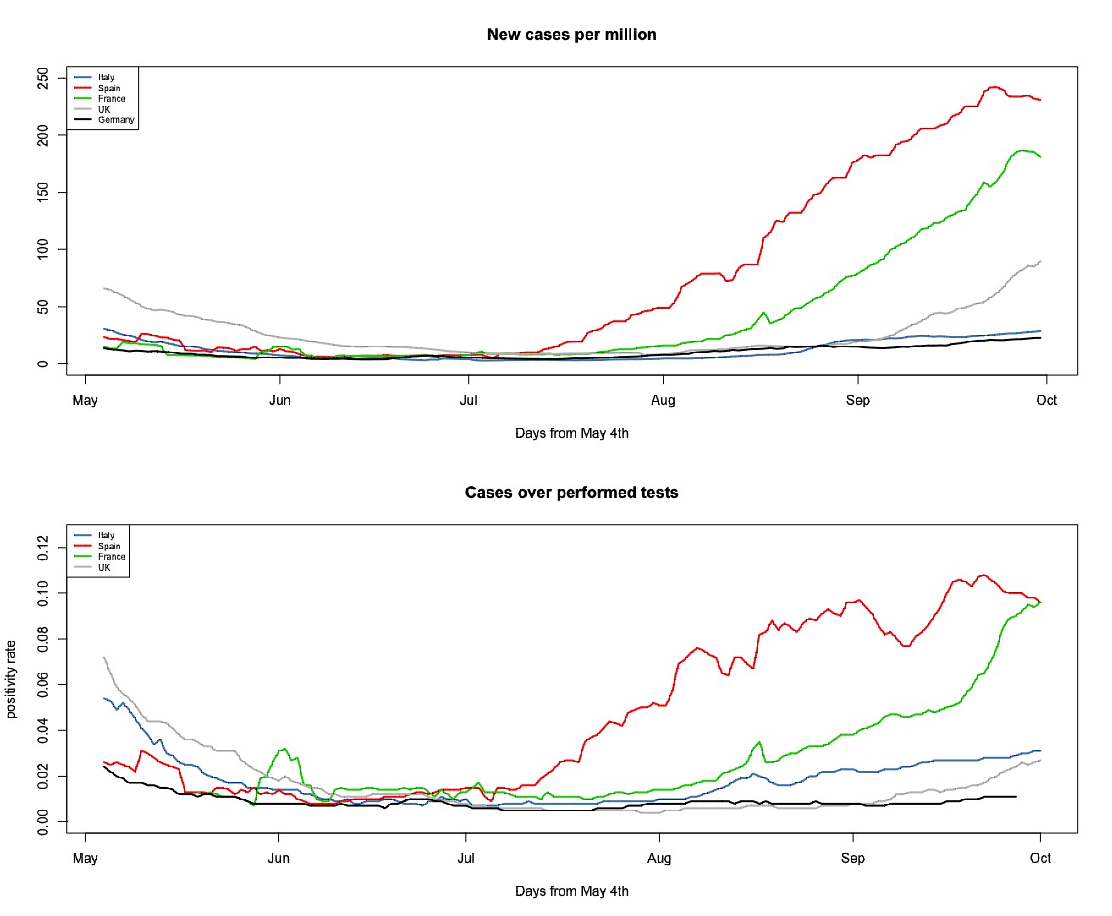
Figure 6: New cases per million (top) and positivity rate (bottom) for Italy (blue), Spain (red), France (green), UK (grey) and Germany (black) from 4 May to 30 September.
About the authors
The authors are all members of Robbayes-C19, a research group spontaneously born in March 2020, composed of researchers from the University of Padua, Udine, Cagliari and Benevento, with robust modeling skills, both in the frequentist and Bayesian frameworks, and experiences of collaborations in medical statistics and epidemiology.


