
Written into the very fabric of the original Constitution is the decree that the commander-in-chief “shall from time to time give to Congress information of the State of the Union and recommend to their Consideration such measures as he shall judge necessary and expedient”. This tradition has continued every year since to the present day.
With a presidential election looming, there is great uncertainty about who will be addressing Congress and what topics will be addressed in the next SOTU address. The 45th president of the United States may proclaim a new era of expanded social programmes across such sectors as education, welfare, and medicine. Or the 45th president may champion stronger border security, increased defence spending, and relaxed firearm regulations.
Whether the next president will be a Republican or a Democrat, whether the next president will be a cerebral orator or a plain-speaking everyman, and whether or not the next president will “make America great again”, one thing is for certain: the 45th president of the United States of America will very frequently say the word “America”.
| Editor’s note This article, by Adam Kashlak, won the 2016 Young Statisticians Writing Competition, jointly organised by Significance and the Young Statisticians Section of the Royal Statistical Society. Adam’s article was originally published in our October 2016 print edition. Congratulations to our winner, and thanks to all those who took part in the competition. There were many fine entries to choose from, and we look forward to reading many more excellent submissions when next year’s competition begins. |
America’s evolution
The SOTU has evolved over the years, both in form and content. The speeches begun by Washington and John Adams were replaced in 1801 by Thomas Jefferson who commenced the tradition of sending a written report to be read before Congress by a clerk. This continued until December 1913, when Woodrow Wilson broke the pattern by addressing Congress in person. Since then, a smattering of written reports have been intertwined with speeches. But in every year since the beginning of Ronald Reagan’s first term in 1981, the sitting president has addressed a joint session of Congress in person.
This corpus, and many other presidential documents, is archived online by The American Presidency Project.1 As a collection of speeches and writings, the SOTU provides an intricate look at how political rhetoric has evolved over the lifespan of the United States. In particular, it can be seen that usage of the words “America” and “American” – and, in the case of President Harding, “Americanization” – has grown substantially since the commencement of the SOTU.
“America” is mentioned sparingly at first, mainly as a utilitarian adjective with which to describe the United States and its peoples (a usage that continues to be a source of justified frustration for the millions of Americans who live south of the US border in places like Mexico, Brazil and Argentina). However, with the outbreak of the War of 1812 between the USA and UK, President Madison began discussing the plight of the American prisoners of war and proclaimed that “the American people will face it with the undaunted spirit which in their revolutionary struggle defeated his [King George III’s] unrighteous projects”. Three decades later, President Polk similarly invoked “America” to announce that “the American principle of self-government was sufficient to defeat the purposes of British and French interference” and to passionately lament the supposed “wrongs and the insults repeatedly offered to American citizens and the American flag by Mexico” – a political statement made in the run-up to the US–Mexican War of 1846–1848. During the Civil War of 1861–1865, President Lincoln called out “a disloyal portion of the American people”, and by World War I, President Wilson was speaking of “Pan-Americanism”, referring not just to the United States but to the entirety of the North and South American continents.
With the advent of radio, President Coolidge spoke directly to the nation in 1923 and stated that “America must be kept American”, a very politically charged proclamation that echoes across time to certain campaign platforms of the present day. From then on, America is invoked for all causes, from Roosevelt’s New Deal – “The program itself comes from the American people” – to Eisenhower’s affront to the East – “American freedom is threatened so long as the world Communist conspiracy exists” – and Nixon’s use of America as an anaphora – “I see an America in which … ”.
When President Obama finishes his tenure as commanderin- chief, he will have amassed 569 “Americas” across his eight SOTU addresses. But what of the 45th president? How frequently will she or he invoke “America” in any, or all, its forms? With the aid of statistics, it is possible to quantifiably track and predict the continued rise of the usage of the word.
Betting on the future
Imagine you are at a racetrack and want to bet on a horse. If the odds on a particular horse are 6 to 1, then if you stake one dollar and win the bet, your profit will be six dollars; otherwise you will lose your single dollar. The horse’s odds of winning its next race could, for example, be estimated by its historical performance. Then, mathematically,

The odds of winning is closely related to the frequency of wins by the formula, frequency = odds/(1 + odds). In the example of the horse race, if the odds are 6 to 1, then the frequency with which the horse wins its races is 1/7 ≈ 14.3%.
Now consider a new game where you bet that a randomly chosen word from the next SOTU address will be “America”. How should the odds be set to make it as fair as possible? From the historical data, such odds can be computed retroactively for each president as odds = (no. of Americas)/ (no. of other words). For example, the odds of Woodrow Wilson saying “America” were approximately 480 to 1, whereas the odds of Barack Obama saying “America” were a much less extreme 93 to 1. To predict the odds of the next president saying “America”, a type of generalised linear model known as logistic regression is used.2 The input to this model is the number of the president (i.e. Washington = 1, Adams = 2, …, Obama = 44), and the output of this model is the logarithm of the expected odds or, succinctly, the log odds. This is displayed in the following equation:
![]()
In this model, a and b are unknown parameters to be estimated from the historical data. The main parameter of interest is b, which is closely related to the percentage increase in the odds, from one president to the next, that the word “America” will be used in the SOTU address. Forty-two historical data points were used to estimate b, representing the 42 presidents that have given a SOTU address (as William Henry Harrison and James Garfield did not survive long enough to do so). From these data points, b was estimated to be = 0.081, with a 95% confidence interval of [0.067, 0.096]. This roughly corresponds to a 7–10% increase in the odds of saying “America” for each subsequent president.
Recall that the odds of Obama saying “America” were 93 to 1. Assuming that the calculated rate of increase holds, the odds on the appearance of “America” in the 45th president’s first SOTU address are approximately 83 to 1. A 95% confidence interval for this value predicts odds between 102 and 67 to 1, which corresponds to a predicted frequency of between 1% and 1.5% – which would mean that the word “America” is more commonly used than the letters j, k, q, v, x, and z, according to standard English-language character frequency tables.
At the risk of extrapolating a bit, if the trend continues, approximately 2.5% of the 54th president’s SOTU address will be the word “America”. For the sake of reference, this surpasses the frequency of the word “America” in Langston Hughes’s poem, “Let America be America again”.
Letting the data speak
A plot of the raw data and the logistic regression in terms of frequencies is presented in Figure 1 along with a 95% confidence band for the regression curve. The confidence band was computed via a bootstrap resampling technique where new data sets are sequentially constructed by sampling with replacement from the original data set. The logistic regression is recomputed on each of these new data sets in order to capture the variability in the estimate. This was performed on 1000 iterates to produce the displayed confidence band demarcated by the upper and lower dashed red lines. It is worth emphasising that this confidence band is for the entirety of the blue regression curve only and not for each individual data point, of which many lie above or below it. In particular, the writings and speeches of presidents Madison, Taylor, and Nixon appear to have a much higher frequency of “America” compared to their historical neighbours. However, this is deceptive.

Figure 1. Plot of the data, the logistic regression (blue), and the 95% bootstrapped confidence band for the regression (red)
Unlike an ordinary least squares linear regression, logistic regression models come with some extra quirks. Firstly, we see that the variance – which corresponds to how far we would expect data points to deviate above and below the regression curve – is not constant. This means that the small deviation of Zachary Taylor may actually be more statistically significant than the larger deviation of Richard Nixon. Secondly, the length of each president’s SOTU speeches and writings differs quite drastically. A longer speech implies more data, which in turn implies a reduction in the variance. This information is lost in Figure 1. However, Figure 2 plots the normalised deviations of the data from the regression curve. These residuals can be treated as the number of standard deviations that a given president deviates from the mean.
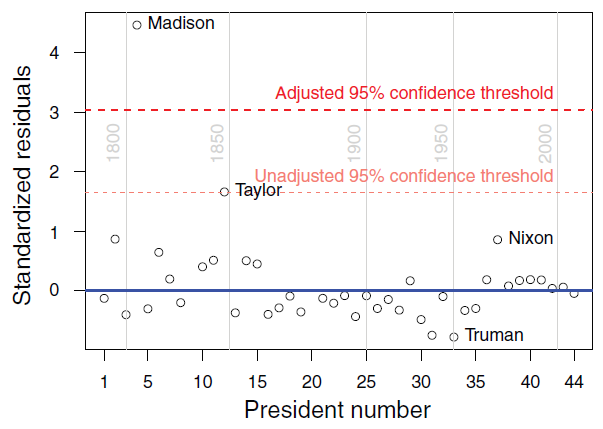
Figure 2. Plot of the standardised residuals for each president with the unadjusted upper 95% confidence limit and the Bonferroni corrected upper 95% confidence limit
Setting the usual 95% upper confidence threshold leaves only two presidents as statistically significant outliers: Madison and Taylor. However, blindly setting this limit is, in fact, applying the 95% confidence interval 42 separate times. This is known as a multiple testing problem. As a result, the probability of at least one false positive, which should be the desired 5%, is actually the astoundingly high 1 − 0.9542 = 88.4%. To fix this, a multiple testing procedure known as the Bonferroni correction, a simple but conservative readjustment, is applied by dividing 5% by 42 and recomputing the threshold. This increases the threshold from 1.645 to 3.04. Zachary Taylor is no longer deemed statistically significant. Only one president lies above the new upper confidence threshold: James Madison. “And in the instance in which skill and bravery were more particularly tried with those of the enemy, the American flag had an auspicious triumph.”
It is doubtful that American political discourse will ever degrade to such a far-gone state that we will witness a newly elected commander-in-chief spend 60 minutes incessantly shouting “America” to the wild applause of the audience. However, the SOTU data speaks to the rise of “America”, not only as a nation but as an idea: from colonial settlement to world power; from adjective to anaphora; from emotionless to emotive; and – most of all – from the regular to the purest rhetoric. The word “America” has gained power, passion, and symbolism. Will this power remain, or will the word’s overuse return such rhetoric to mere cliché and routine? Only time will tell.
- Adam B. Kashlak is a PhD student in mathematical statistics at the University of Cambridge. Previously, he was a statistician for the US Department of Defense
References
- Peters, G., and Woolley, J. T. The American Presidency Project. http://www.presidency.ucsb.edu/sou.php, 2016. [Online; accessed 13-March-2016]. ^
- Myers, R. H., Montgomery, D. C., Vining, G. G. and Robinson, T. J. (2012) Generalized Linear Models: With Applications in Engineering and the Sciences. Hoboken, NJ: John Wiley & Sons. ^


