
The pandemic of coronavirus disease (Covid-19) triggered by the SARS-CoV-2 virus has forced the governments of many states to introduce measures of social distancing that restrict personal mobility. In the absence of a vaccine or effective treatments, limiting the interaction between individuals is one of the few tools available to combat the epidemic and to plan a return to normality.
In Italy, prime ministerial decrees issued from 9 March 2020 introduced more and more stringent measures: schools were shut down, all non-essential shops and production companies were closed, and people were told to stay at home. However, exemptions within these decrees allow citizens to leave their homes for reasons of emergency, to buy food, and to work in essential sectors.
To what extent have these decrees, and their exemptions, changed the way people move around? In Italy, thanks to mobile phone technology, we have been able to make some assessment of the public’s compliance with mobility restrictions during the period of maximum growth of infections and hospitalisations. We have done this using a smartphone application originally designed to monitor, detect and alert users to nearby earthquakes.
The app was previously discussed in Significance back in 2016.1 It forms part of a project called “Earthquake Network” (www.sismo.app), in which members of the public are invited to download the app. Once installed on a smartphone, the app serves two purposes: it uses data from a phone’s accelerometers to provide real-time seismic monitoring and, when a seismic event is detected, the app uses a phone’s location data to alert users who are in or near the vicinity of an event.
In order to provide real-time detection and alerts, the app collects phone location data approximately once every 30 minutes. The location data is sent anonymously to the processing server, which is responsible for identifying the seismic event thanks to a statistical approach.2 Although the data is anonymous, each user has a unique identifier. It is therefore possible to track the movements of each smartphone/user for 24 hours a day. All of this takes place in compliance with privacy and the General Data Protection Regulation, allowing the user to delete their data from the server if requested.
For our analysis of movement under the coronavirus lockdown, we used location data for the period 10 March – 1 April 2020, based on a sample of about 20,000 Italian app users. The daily trajectory of each user was analysed in order to evaluate the average distance travelled each day by users and the percentage of users who had not moved within 24 hours. The task was made more difficult by the fact that the reported location of smartphones is affected by uncertainty (ranging from a few meters to a few kilometres) and by the fact that a smartphone may be subject to “ghost” movements, due to the increase in uncertainty about its position rather than to any real movement. However, techniques such as the Kalman filter allow us to estimate a trajectory faithful to the true trajectory travelled by the smartphone and to understand which smartphones actually moved.
Figure 1 shows, for each date, the average distance travelled by users (blue line) and the percentage of users who had not moved within a 24-hour period (orange line). We refer to this latter group as “% #IStayAtHome”, in reference to the Twitter hashtag widely used by people tweeting in support of the lockdown. Confidence intervals are obtained using the bootstrap technique. The trend begins on 10 March and stabilises on 22 March. Both lines show spikes on Sundays, and the orange line gives a steady lockdown level near 65% for working days towards the end of the study period. Meanwhile, the blue line shows that the daily mean distance travelled decreased by approximately 50% over the period. These figures are consistent with the reduction of vehicle emission of nitrogen oxides observed in Lombardy by Fassò and Maranzano.3
It is worth noting that the app data come from a self-selecting sample, rather than a random sample, and that, typically, the Earthquake Network app is not used by children nor older people. Hence, we think that the “true” population figures for average distance travelled and percentage staying at home could show an even steeper trend.
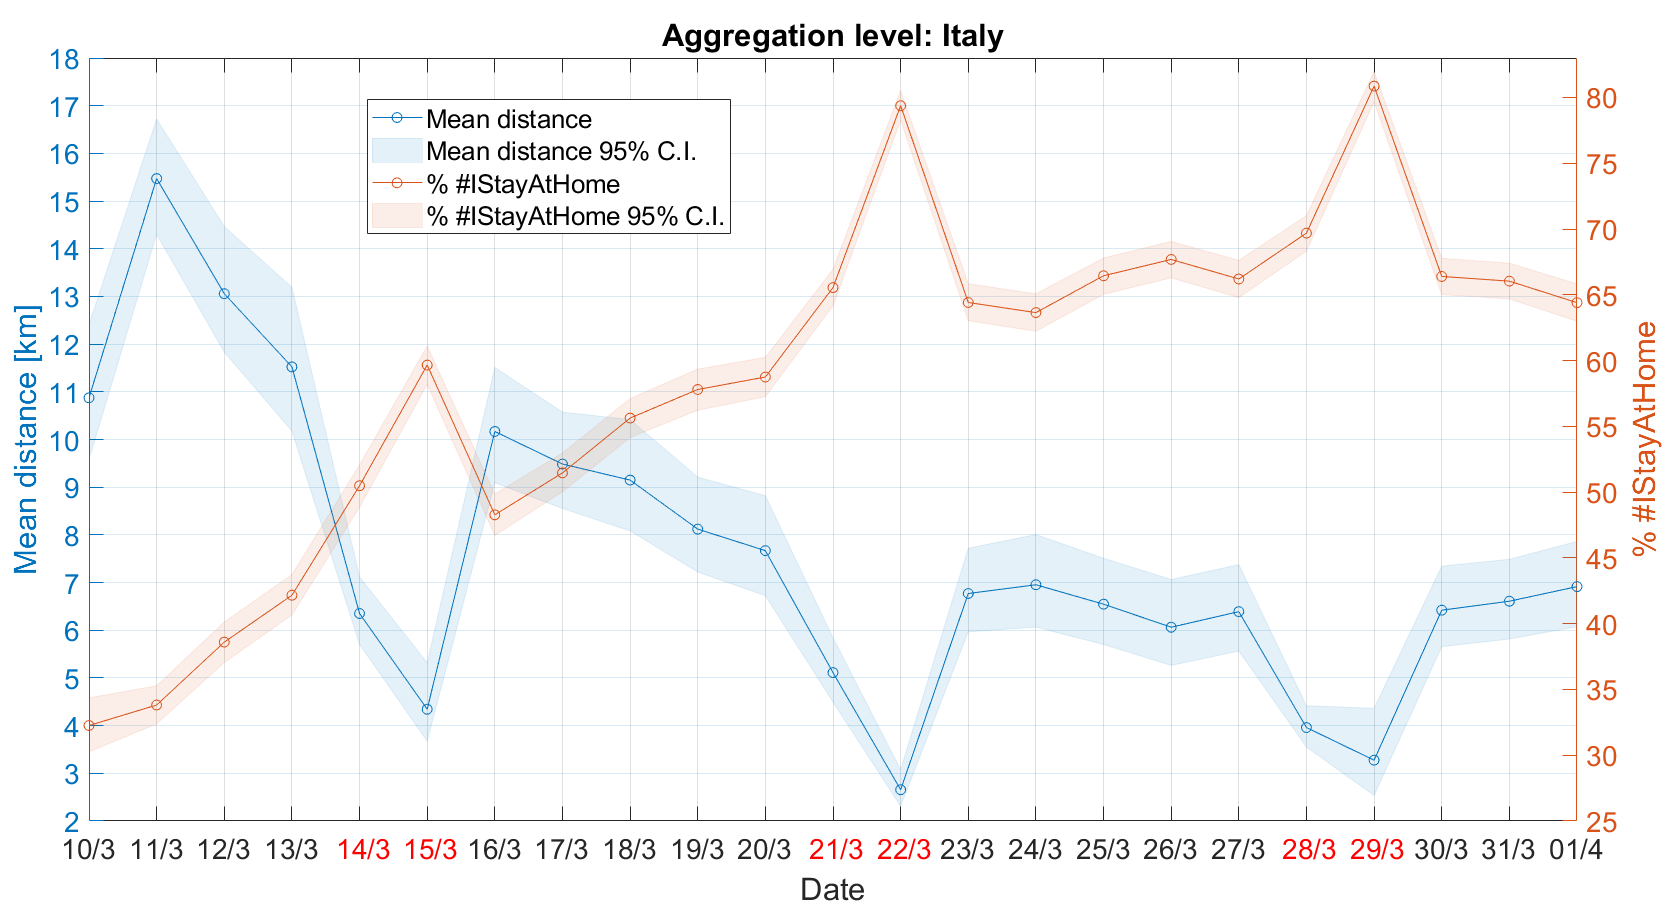
FIGURE 1 Mobility in Italy estimated through smartphone data collected by the Earthquake Network project. The orange line represents the percentage of users who have not moved within 24 hours. The blue line represents the average daily distance travelled in kilometres. Confidence intervals obtained through bootstrap technique. On the horizontal axis, Saturdays and Sundays are shown in red.
If the coronavirus pandemic persists or occurs cyclically, large-scale monitoring of the population and of the risk of contagion is likely to be adopted. In this context, it will be useful to have a statistical methodology for modelling the mobility of individuals at the personal level and the interaction between them, as well as having dedicated apps for receiving alerts in case of increased personal risk.
About the authors
Francesco Finazzi is professor of statistics at the University of Bergamo, Italy. He is the founder of the Earthquake Network project and his current research interests are in space-time models, sensor networks and crowdsourcing data analysis.
Alessandro Fassò is professor of statistics at the University of Bergamo, Italy. In the last 20 years he has focused his research activity on environmental statistics, spatiotemporal models and uncertainty of measurements in the upper atmosphere.
References
- Finazzi, F. (2016) How a smartphone network detects earthquakes in real time. Significance, 13(6) 6-7. ^
- Finazzi, F. and Fassò, A. (2017) A statistical approach to crowdsourced smartphone-based earthquake early warning systems. Stochastic Environmental Research and Risk Assessment, 31, 1649-1658. ^
- Fassò A. and Maranzano P. (2020) The impact of COVID-19 pandemic on air quality. Statistica e Società, year IX, 2/2020, in Italian, http://www.rivista.sis-statistica.org ^


