Everything started some time ago, when Craig Bennett was an innocent PhD researcher in cognitive neuroscience at the Department of Psychology of the University of California at Santa Barbara. A routine task, that of calibrating and testing a brain scanner to be sure it was working properly, apparently turned out to be a paranormal experience, which he and his colleagues published in the Journal of Serendipitous and Unexpected Results. For the test he used a dead salmon: “The salmon measured approximately 18 inches long, weighed 3.8 lbs, and was not alive at the time of scanning. It is not known if the salmon was male or female, but given the post-mortem state of the subject this was not thought to be a critical variable.” As a matter of fact, he repeatedly tested the scanner with all kinds of things, including a pumpkin and game hens. He didn't tell whether the pumpkin was carved or not, though.
Functional magnetic resonance imaging (fMRI) in essence uses very potent magnets to record changes in blood flow in the brain. In order to account for all possible sources of error it is essential to test the brain scanner making everything as close as possible to a true experience. “Foam padding was placed within the head coil as a method of limiting salmon movement during the scan, but proved to be largely unnecessary as subject motion was exceptionally low.” These guys have a sense of humour! I bypass here some technical details… “A mirror directly above the head coil allowed the salmon to observe experiment stimuli. The task administered to the salmon involved completing an open-ended mentalizing task. The salmon was shown a series of photographs depicting human individuals in social situations with a specified emotional valence, either socially inclusive or socially exclusive. The salmon was asked to determine which emotion the individual in the photo must have been experiencing.”
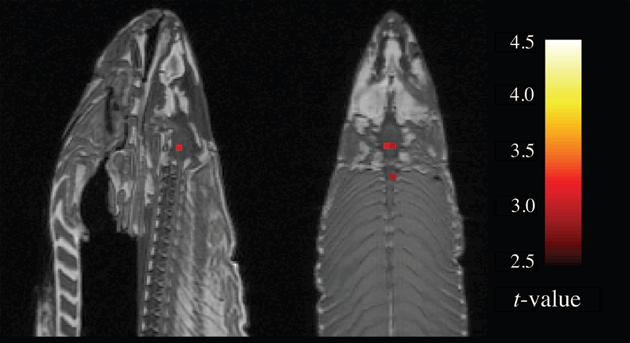
Brain scan of our salmon with t-values uncorrected for multiple comparisons. Source: Bennett et al. (2010)
The brain scanner provides 3D images of the brain. The 140 images acquired during the test were processed using proper software and they applied standard statistical techniques to the data points. In this case, data points are named voxels, which are nothing else than the three dimensional equivalent of pixels. By looking at the differences in the measured signal between images taken during the task and at rest, it is possible to identify which parts of the brain are activated during the mental task. To do this, they applied a statistical test, a t-test, using a significance level of 0.001 to groups of three voxels. The test provides us a t-value that is used to determine the p-value, which is the probability of obtaining a value as big as the one we have observed or bigger, assuming that the null hypothesis is true –in this case, that there is no neural activity. Essentially if the p-value is lower than the significance level, we accept that there is a difference –in this experience that means there is some neural activity – not due to random causes –for example, noise in the measurements-. The result of the test was that several voxels showed p-values lower than 0.001, so that apparently a cluster of several voxels activated in the salmon's brain and in the dorsal spinal column! According to Fisher's scale, if p-values in a single comparison are lower than 0.001 we can assume there is more than overwhelming evidence that there is a difference. Of course, we know the salmon was dead and it was more than unlikely that any brain activity was taking place. So, what was going on?
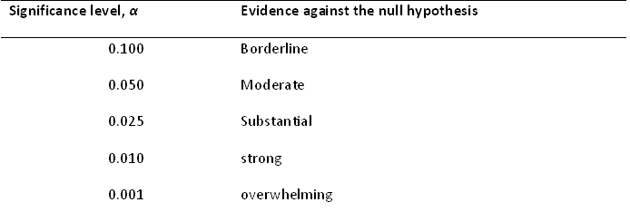
Fisher’s scale of evidence to interpret p-values. Source: Efron (2010)
The problem, as Craig Bennett and his colleagues were well aware of, is that in this case they were making multiple comparisons in a big data set. And classical statistical techniques are not applicable to this situation. Let me explain why. An fMRI image contains thousands of voxels –an image of the human brain contains about 60,000 voxels- and with such a number of comparisons to be made a number of false positives are expected to occur. Many researchers try to control for the occurrence of false positives by using low significance levels of 0.001-0.005 (the usual standard is 0.05) and making the comparison for groups of 6-20 voxels, instead of individual voxels. But as shown by C. Bennett and colleagues this is not enough and large-scale inference methods should be applied instead. When they applied one of these methods, Benjamini-Hochberg’s correction, all after-death thinking activity in the salmon measurements disappeared. So, it was only a false positive after all…
The problem is that, according to Bennett and colleagues, before their article between 26% and 40% of neuroimaging papers published in scientific journals (see the table below) didn’t report using multiple comparisons corrections, which means that a substantial proportion of research should be reviewed. Luckily, Bennett’s message sank in and after a follow-up survey of a couple of journals last year, fewer than 10% of papers used incorrect statistics. A happy ending for a scary movie of statistics usage.
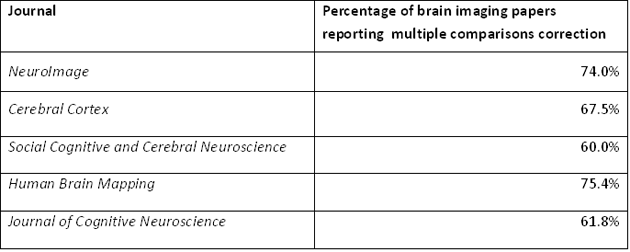
Source: Bennett et al. (2010)
By the way, in September the work of Bennett and his colleagues was awarded with an Ig Nobel prize, a prize that recognises research “that first make people laugh, then make them think.”


