
The public inquiry into the Mid Staffordshire National Health Service Trust again raises the question of how to monitor the performance of individual hospitals and NHS Trusts. Recently, the NHS Information Centre together with researchers from the University of Sheffield has developed a Summary Hospital-level Mortality Indicator (SHMI) which has been published for all acute trusts excluding specialist hospitals since 2011. In the following we will briefly look at how the SHMI is calculated and the two approaches used to estimate the range within which the SHMI would be expected to lie for each trust (see Spiegelhalter 2005 for details). There is a significant difference between the methods in the number of trusts which have a mortality index which is higher than expected and we will briefly the reasons for this and comment on the appropriateness of each method.
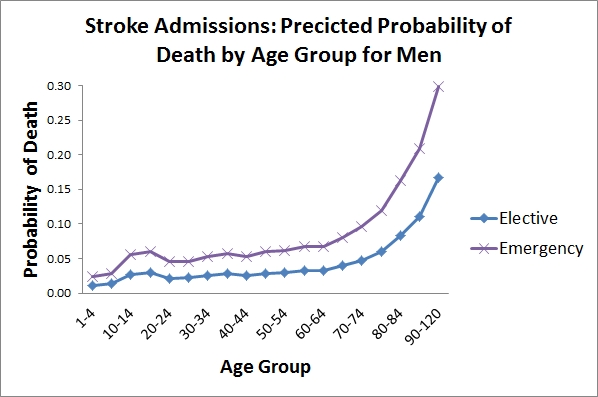
The SHMI is calculated as the ratio of the number of observed deaths in a trust in a year to the number of deaths that would be expected in the trust after taking into account the characteristics of the patients admitted to the trust. For example, trusts which have higher numbers of admissions at older ages would be expected to have higher mortality rates and adjusting for such differences in patient characteristics allows comparisons between trusts to be made on as close to a like-with-like basis as possible. The characteristics of patients are taken into account by using a regression model where the outcome is the probability of a patient dying in hospital or within 30-days of discharge and the standardising variables are age, comorbidity (ie. other illnesses), admission method (elective or emergency), gender and year. A separate model is estimated for each of 140 diagnosis groups (eg. stroke, acute bronchitis). The coefficients from each model are published by the Information Centre and the figure below shows the results of using the coefficients from the most recent SHMI publication to examine how the probability of death varies with age for a man with no comorbidity who is admitted with a stroke, as an elective and as an emergency admission. The figure shows that the probability of death rises with age with emergency admissions having a probability of death roughly twice that of elective admissions at all ages. In calculating the SHMI for each trust the number of expected deaths is found by multiplying the number of admissions with each combination of the standardising variables by the probability of death. For example, if a trust has 100 emergency admissions with a stroke among otherwise healthy men over 90 years of age, the number of deaths expected in this group would be around 30 (given a probability of death of 0.3 in this group in the figure below). The total number of expected deaths is then calculated by adding-up the number of expected deaths in each diagnosis group.
The SHMI for each trust can be presented using a funnel plot which plots the SHMI on the y-axis and the expected number of deaths on the x-axis. The thresholds (or control limits) at which the SHMI is significantly different from unity are also plotted and the plot gets its name because the limits have the shape of a funnel. The reports use two approaches to calculating the limits; what might be termed a naive method (exact poisson limits) that uses only the expected number of deaths in a trust, and a more complex method (over-dispersion limits) that also takes into account the between-trust variation in the expected number of deaths. The method used to calculate the limits makes a significant difference to the number of trusts which are considered to have death rates that are higher or lower than expected. The figure(s) below (published in 2012) show funnel plots for the same set of patient data, first using the exact limits and then using the over-dispersion limits (the dashed lines).
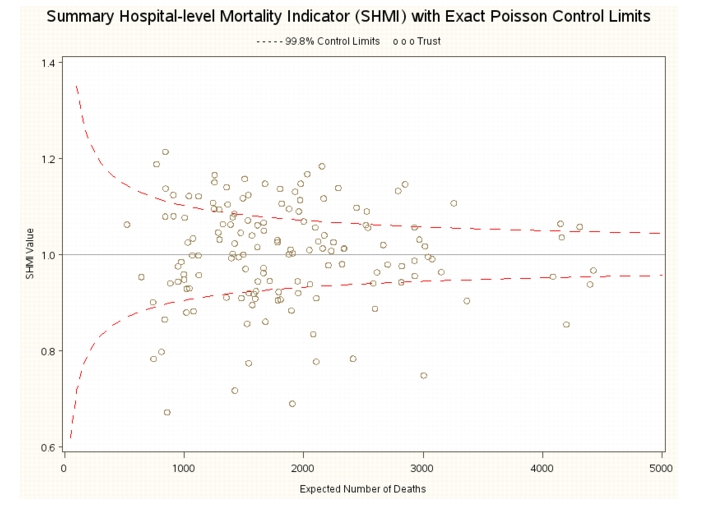
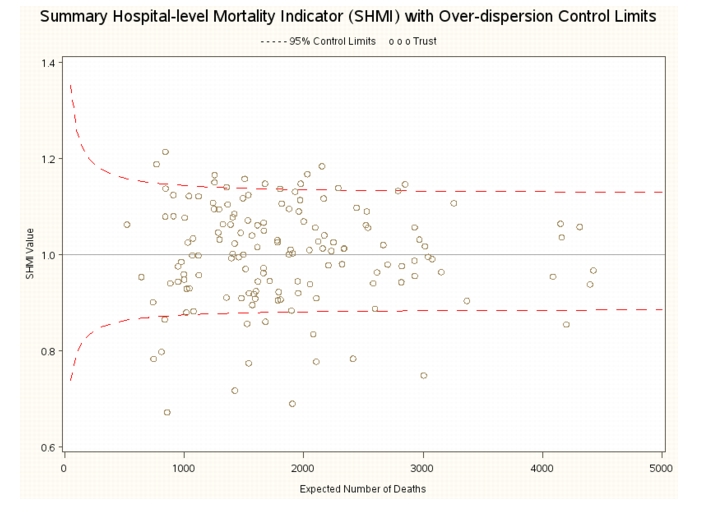
The first plot shows that using the exact limits, 34 trusts have a SHMI that is above the control limit (or is significantly higher than unity), while the second plot shows that only 10 trusts have a SHMI above the control limit using the over-dispersion limits. What explains this difference? The exact limits show the range within which the SHMI would be expected to lie if all trusts had similar mortality rates for similar patients. As the number of expected deaths in a trust rises, the independent idiosyncratic differences associated with each patient tend to average out and the confidence limits show how the variability that we expect in the SHMI declines as the number of deaths rises. On the other hand, the over-dispersion limits show the range within which the SHMI would be expected to lie if we expect the probability of dying for similar patients to vary across trusts and include a term reflecting this source of variation in the calculation of the limits. Because the over-dispersion limits include a source of variation additional to patient differences they are wider than the exact limits. In addition, because the component of variability due to trusts is shared for all patients in a trust rather than varying independently from patient-to-patient, its contribution to the calculation of the limits does not decline as the expected number of deaths increases. The over-dispersion limits therefore do not narrow in the same fashion as the exact limits as the expected number of deaths increases (the limits in the second plot look more like a fallen oak than a funnel).
The NHS uses the over-dispersion limits to monitor the performance of trusts and a small number of trusts are to face investigation due to their higher than expected number of deaths. If the exact limits were used to monitor performance, the number of trusts facing investigation would be much higher. I doubt, however, that an approach which considered more than a handful of trusts as having higher than expected mortality would have much credibility within the NHS. What is important to realise is that the over-dispersion limits include a component of variation arising from trusts (not just from patients) and in using them to monitor performance the NHS is implicitly accepting that the performance of trusts will vary in a significant way even after standardising for patient characteristics. The public might expect the NHS to be organised similarly across the country but the number of trusts with a SHMI outside the exact limits show that this is certainly not the case. While the exact limits may not be used by the NHS to monitor performance, they are helpful in highlighting the extent to which there are differences in mortality rates between trusts across England. If policy makers want to see a decline in mortality differences between trusts they first need to recognise how large these appear to be.


