
At the 2020 Republican National Convention, Assistant to the President for Economic Policy and Director of the United States National Economic Council Larry Kudlow stated that as President Trump took office, he was ”…inheriting a stagnant economy on the front end of recession,” and under the President, “…the economy was rebuilt in three years.” This is consistent with the repeated claims by Trump and members of his administration that they faced a weak economy when Trump took office and had built a strong economy.
Many of Trump’s opponents counter that Trump inherited a steadily growing economy from President Obama and that what occurred in the US economy during Trump’s first three years in office was nothing more than an extension of trends established during the last several years of the Obama administration. In his speech on the first night of the convention, Trump stated that prior to the spread of the Covid-19 pandemic, “…we were going in a direction like we had never seen — the most successful economy in the history of our country, the best unemployment numbers in history.”
Did the US economy under the Trump administration accelerate, decelerate, or maintain the course established by its predecessor? In this article, we use least squares regression models to estimate economic trends established during the last five years (2012–2016) of the Obama administration and then project those trends into the first three years (2017–2019) of the Trump administration. We utilize data from the last five years of the Obama administration because this provides a reasonable number of data points for estimating these trends. We use data from only the first three years of the Trump administration because of the impact the global Covid-19 pandemic has had on the US economy during the fourth year of the Trump presidency.
We focus on trends because measures of economic behavior that are taken over a single period often reflect short term conditions or unique events that are unrelated to economic conditions. By analyzing economic trends, we avoid reacting to nonsystematic changes in economic conditions, which enables us to achieve greater insight into patterns in economic activity that are due to meaningful changes in the economy.
In each analysis, the periods of data for the final five years of the Obama administration are numbered consecutively (from 1 through 20 for the economic measures collected on a quarterly basis, from 1 through 60 for the economic measures collected on a monthly basis, and from 1 through 2,179 for the economic measure collected on a daily basis) to create the explanatory variable time (t) used in the regression models. When fitting a nonlinear trend is more appropriate, t2 is included in the regression model as a second explanatory variable to facilitate estimation of a quadratic trend.
Once the trend for the final five years of the Obama administration is estimated, we extrapolate the trend into the first three years of the Trump administration and compare what the Trump administration has achieved to the projection of the Obama era trend.
We consider six measures of macroeconomic performance of the US economy. Three of these measures (gross domestic product, net change in jobs, unemployment rate) have quarterly periodicities, two (median weeks unemployed, inflation rate) have monthly periodicities, and one (Dow Jones Industrial Average) has a daily periodicity.
Gross domestic product
A nation’s gross domestic product (GDP), or total value of goods produced and services produced in a nation during a period, is a bellwether for the overall health of the nation’s economy. The US Bureau of Economic Analysis seasonally adjusts its estimates of GDP to remove fluctuations that generally occur at about the same time and with similar magnitude each year. The adjusted values provide greater insight into patterns in economic activity that are due to meaningful changes in the economy.
The linear trend regression model for seasonally adjusted annualized quarterly percent change in GDP estimated over the last five years of the Obama administration is ŷt = 2.1253 + 0.0119t, where ŷt is the estimated seasonally adjusted annualized quarterly percent change in GDP in quarter t. This model indicates that the last five years of the Obama administration established a 2.13% fixed rate of growth in seasonally adjusted annualized quarterly percent change in GDP with a negligible increase (0.01%) per quarter.
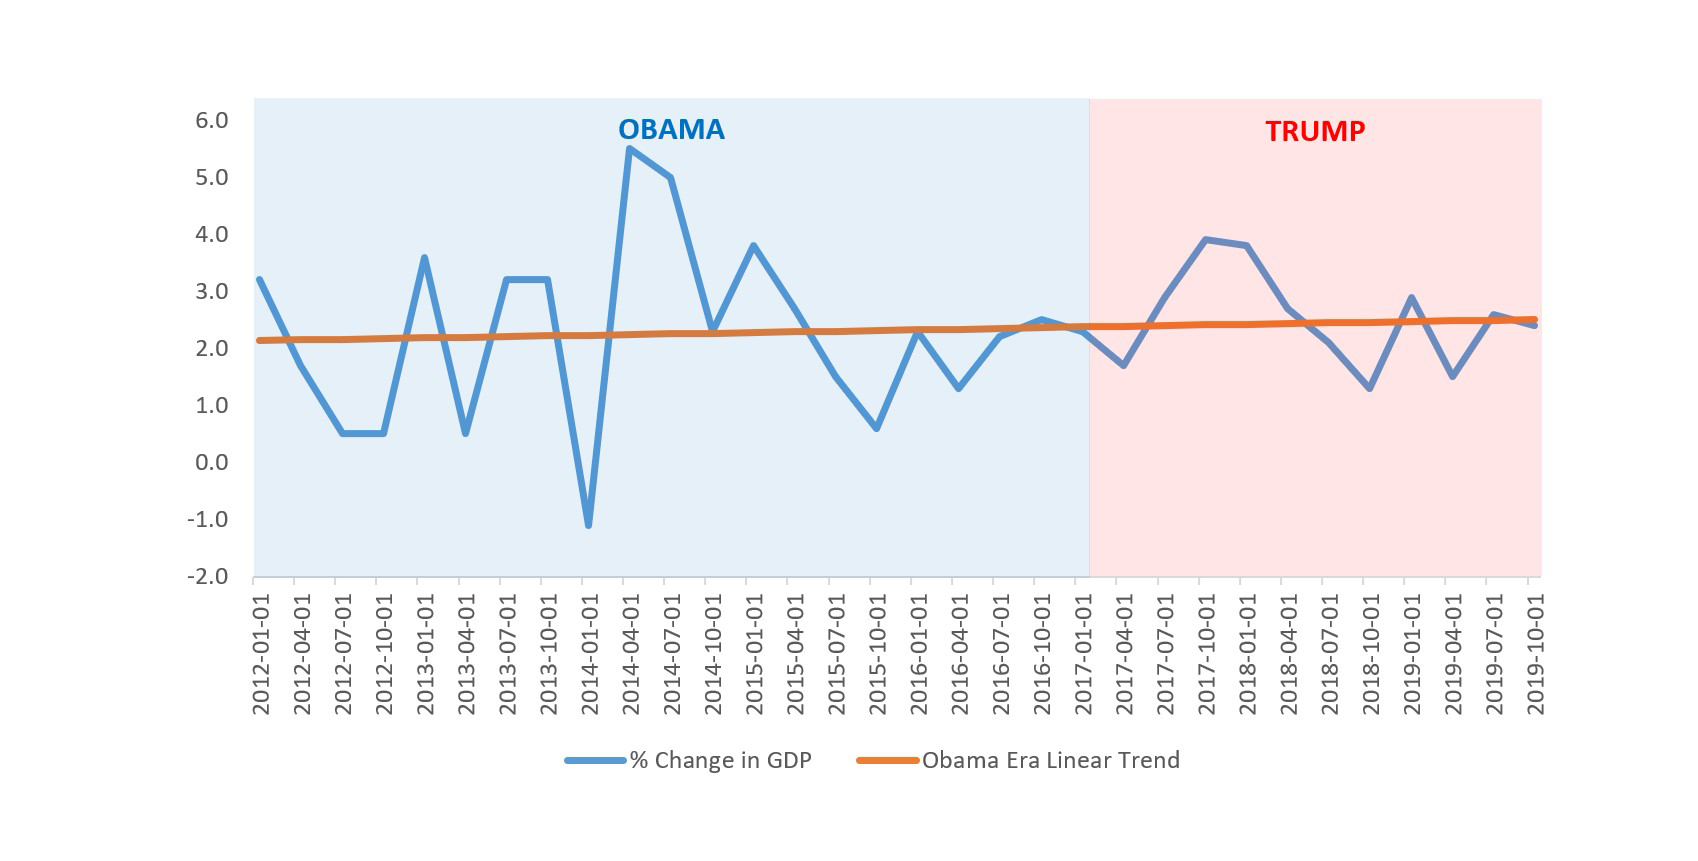
Figure 1: Linear trend in percent change in seasonally adjusted annualized quarterly GDP established during the last five years of the Obama administration, projected into the first three years of the Trump administration (data source).
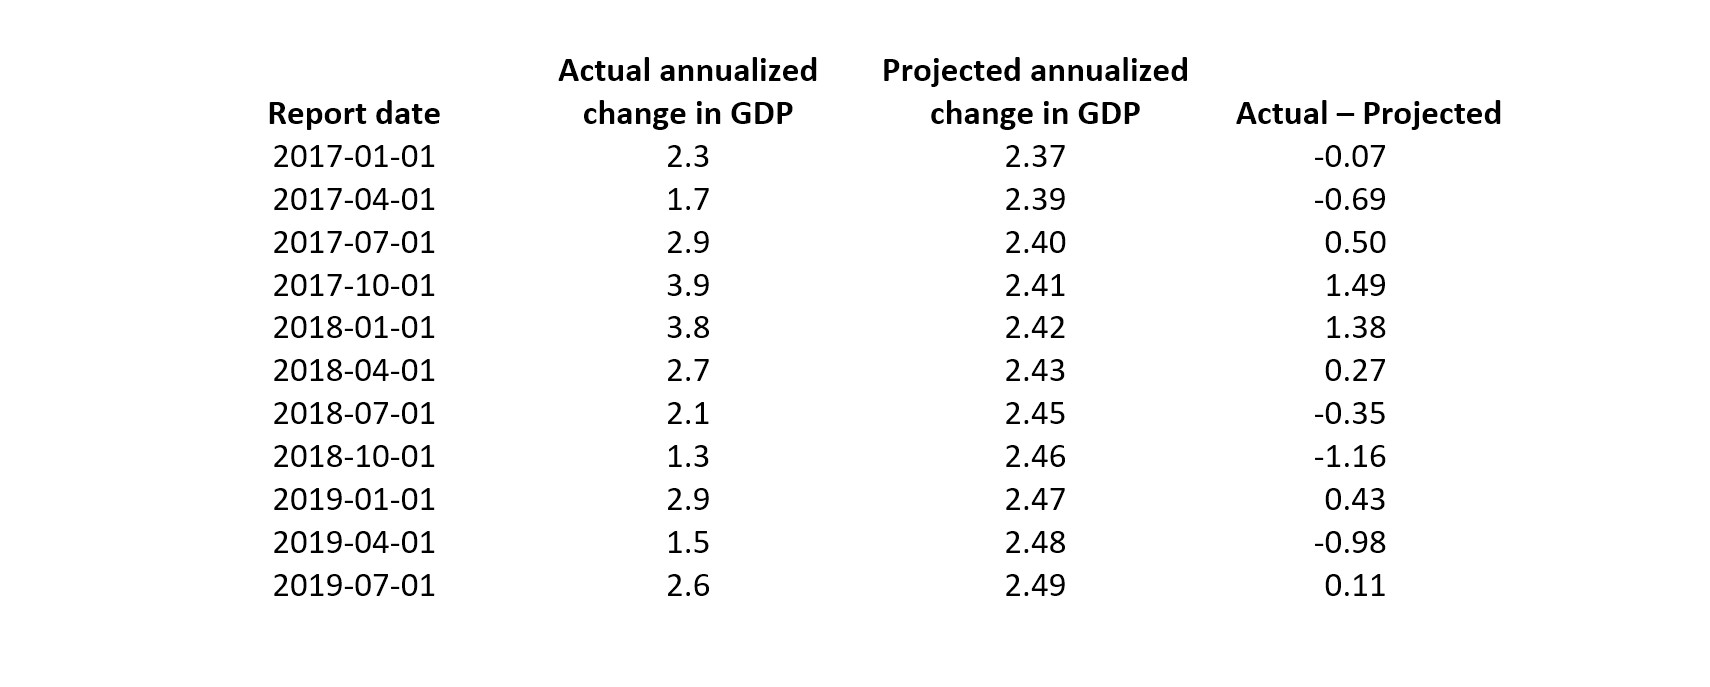
When we project the linear trend established during the Obama administration into first three years of the Trump administration (which began on 20 January 2017), we see several quarters in which the Trump administration exceeded the trend and several quarters in which the Trump administration failed to meet the trend (Figure 1). Table 1 provides the corresponding values, and the sum of the Actual – Projected column suggests that the Trump administration has slightly outperformed the trend in GDP that was established during the Obama era.
Table 1: Actual and projected percent change in seasonally adjusted annualized quarterly GDP during the first three years of the Trump administration.
Net change in jobs
The number of jobs a nation’s economy gains or loses during a period is an important indicator of economic growth. The linear trend regression model for quarterly net change in jobs estimated over the last five years of the Obama administration is ŷt = 681.7158 – 7.7872t, where ŷt is the estimated net change in jobs in quarter t. This model indicates that during the last five years of the Obama administration, the US economy consistently added jobs, but at a slightly declining rate.
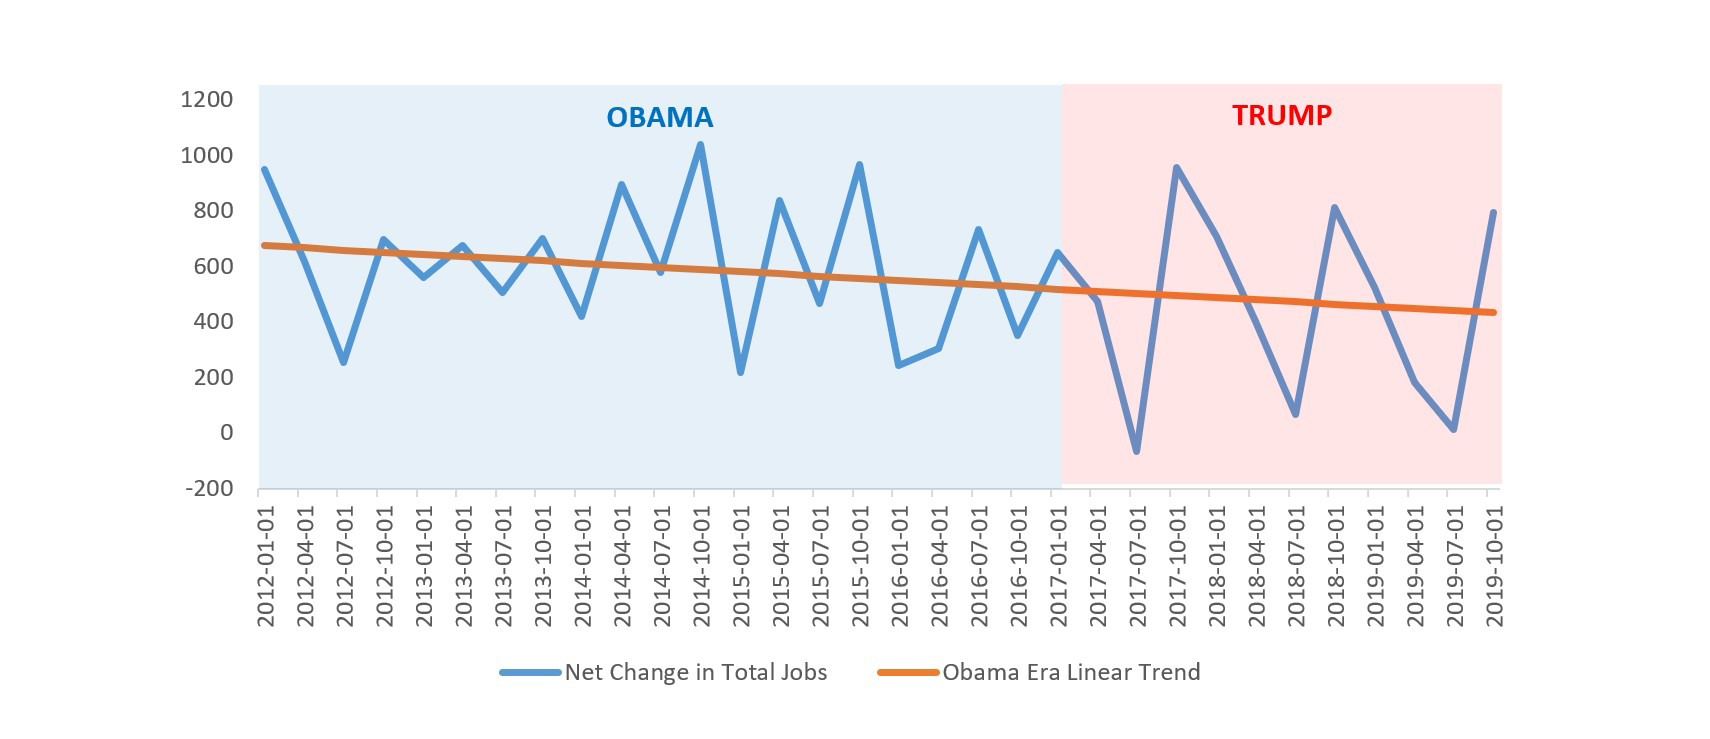
Figure 2: Linear trend in quarterly net change in jobs established during the last five years of the Obama administration, projected into the first three years of the Trump administration (data source).
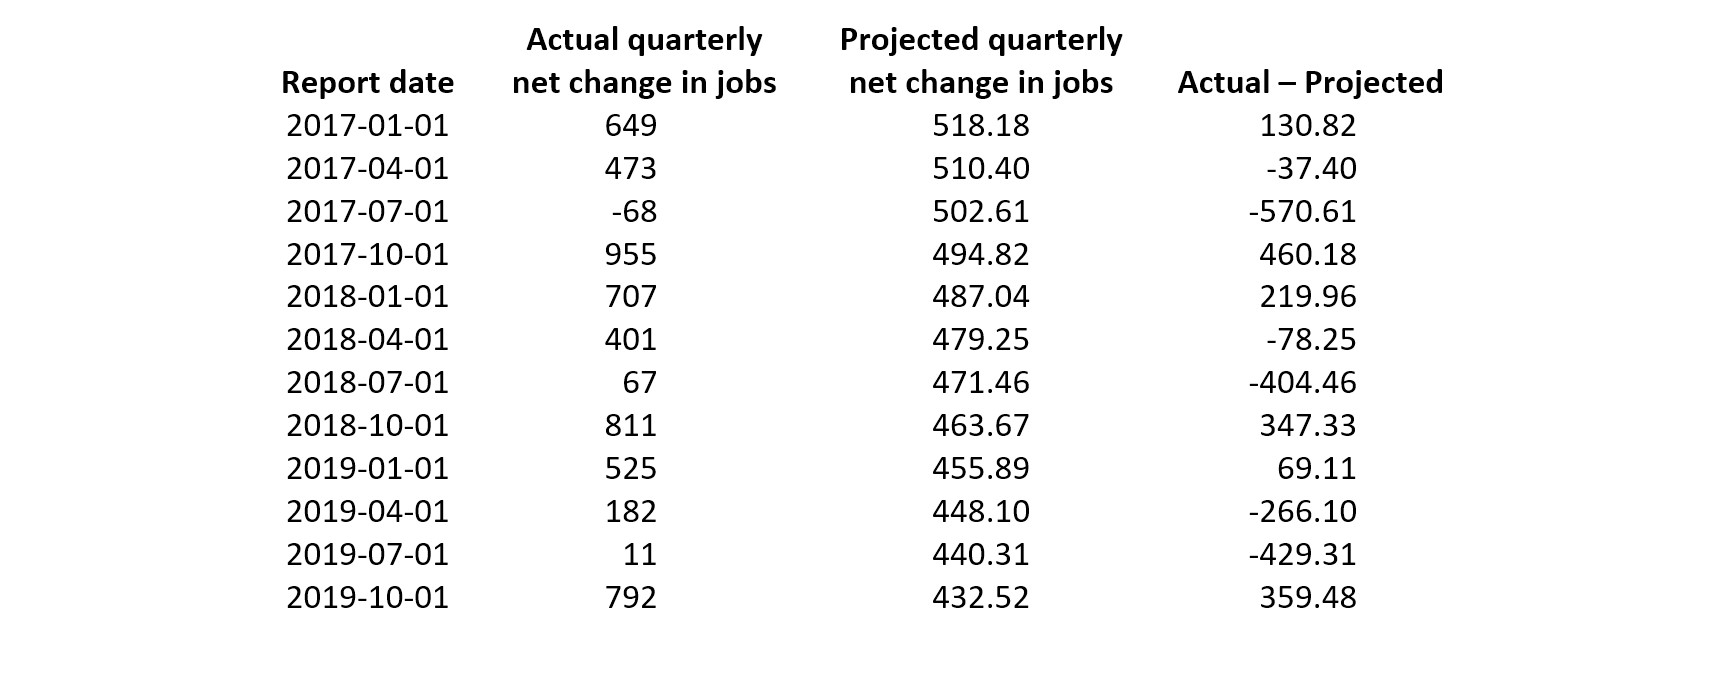
Figure 2 shows that when we project the linear trend established during the Obama administration into the first three years of the Trump administration, we see several quarters in which the Trump administration exceeded the trend and several quarters in which the Trump administration failed to meet the trend. Table 2 provides the corresponding values, and the sum of the Actual – Projected column suggests that the Trump administration has slightly underperformed relative to the trend in net change in jobs that was established during the Obama era.
Table 2: Actual and projected quarterly net change in jobs during the first three years of the Trump administration.
Unemployment rate
A nation’s unemployment rate, or proportion of its civilian population that is actively seeking but cannot find full-time employment, is an important indicator of the breadth of financial hardship in its economy. A plot of the data in Figure 3 provides compelling evidence that the trend in the quarterly unemployment rate for the last five years of the Obama administration is not linear; indeed, if we used a linear trend, we would project negative unemployment 21 quarters after the Obama administration left office.
For our analysis of the unemployment rate, it is therefore more reasonable and fair to project a curvilinear trend from the last five years of the Obama administration into the first three years of the Trump administration. To accomplish this, we add a second response variable, t2, to our regression model.
The quadratic trend regression model for Quarterly Unemployment Rate estimated over the last five years of the Obama administration is ŷt = 8.8858 – 0.29816t + 0.0041t2, where ŷt is the estimated unemployment rate in quarter t. This model indicates that during the last five years of the Obama administration, the unemployment rate was declining but the rate of decline was gradually slowing.
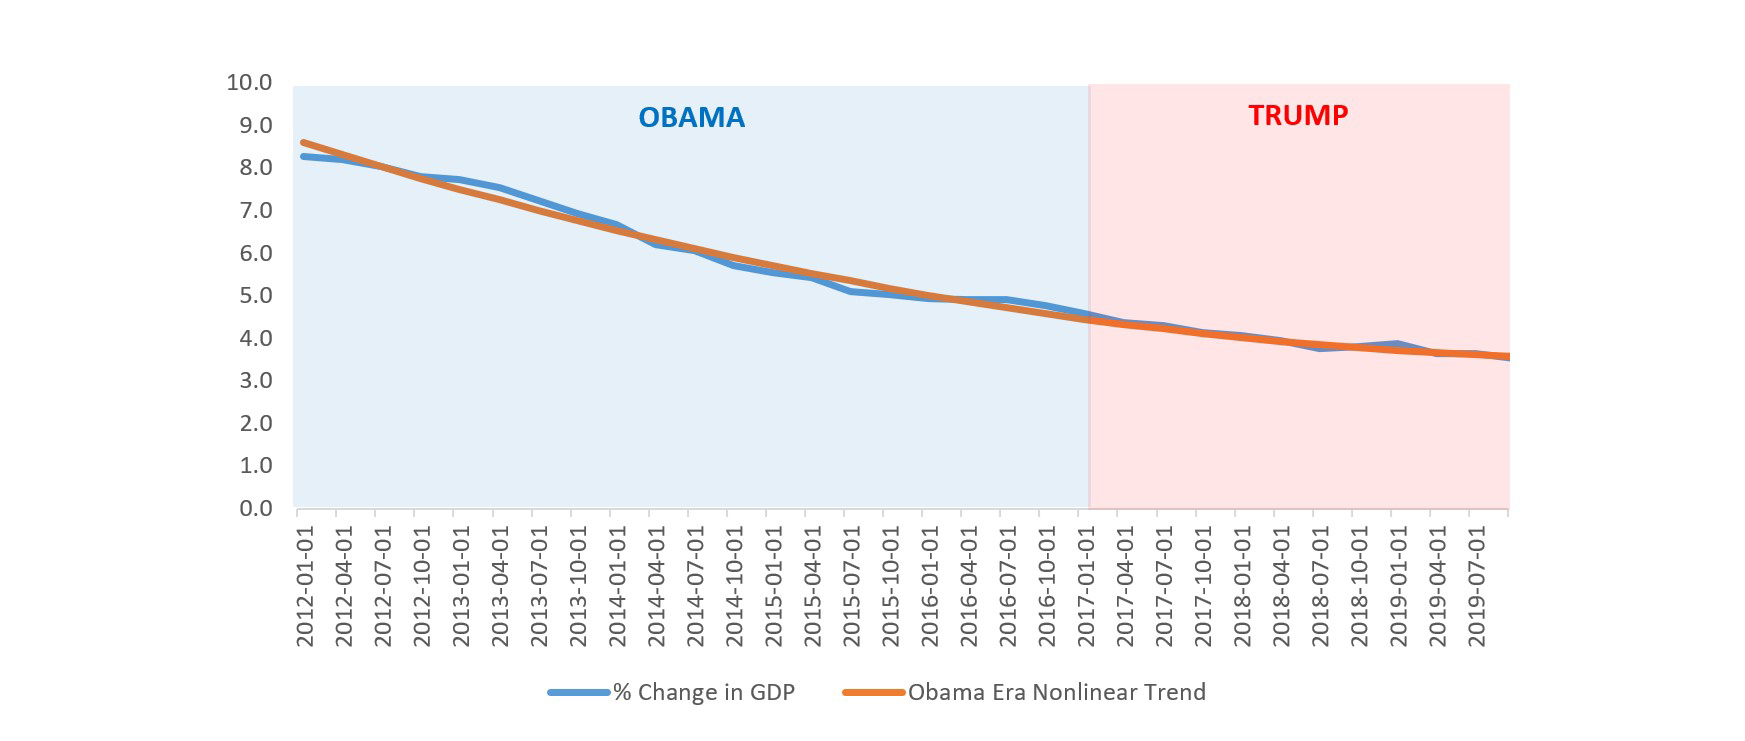
Figure 3: Curvilinear trend in the quarterly unemployment rate established during the last five years of the Obama administration, projected into the first three years of the Trump administration (data source).
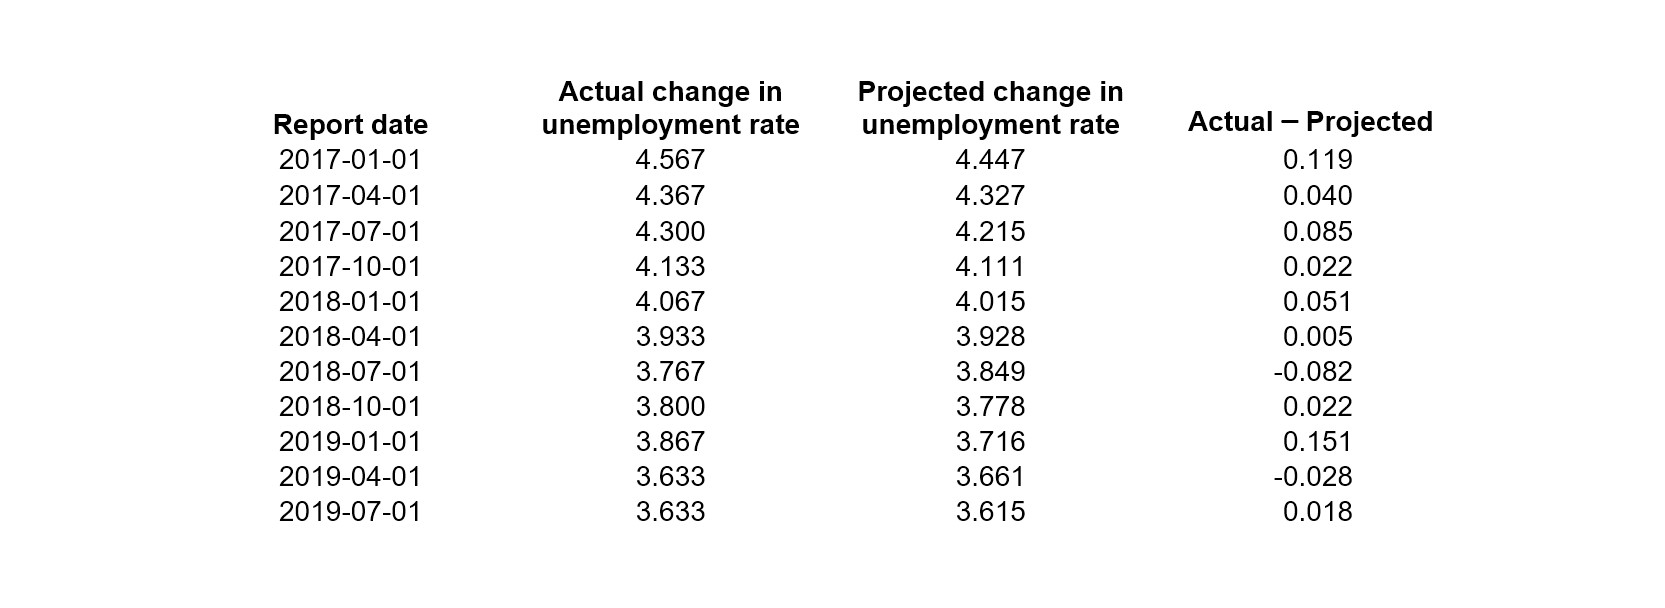
Figure 3 shows that when we project the curvilinear trend established during the Obama administration into the first three years of the Trump administration, the Trump administration maintained the trend in reduction in the unemployment rate. Table 3 provides the corresponding values and demonstrates that the performance of the Trump administration follows the trend extremely closely.
Table 3: Actual and projected quarterly unemployment rates during the first three years of the Trump administration.
Median weeks unemployed
Although it generally is not discussed as often as the other measures of economic performance considered in this article, median weeks unemployed is an important gauge of the depth of economic hardship experienced by a nation’s unemployed. However, as is the case for quarterly unemployment rate, extrapolation of a linear trend for monthly median weeks unemployed established during the Obama era would soon lead us into “negative median weeks unemployed” territory. As a result, we use a curvilinear model to estimate this trend, and again include a second response variable, t2, in this regression model.
The resulting quadratic trend regression model for median weeks unemployed estimated over the last five years of the Obama administration is ŷt = 20.8075 + -0.2546t + 0.0012t2, where ŷt is the estimated median number of weeks unemployed in month t. This model indicates that in the last five years of the Obama administration, median weeks unemployed was declining but the rate of decline was gradually slowing.
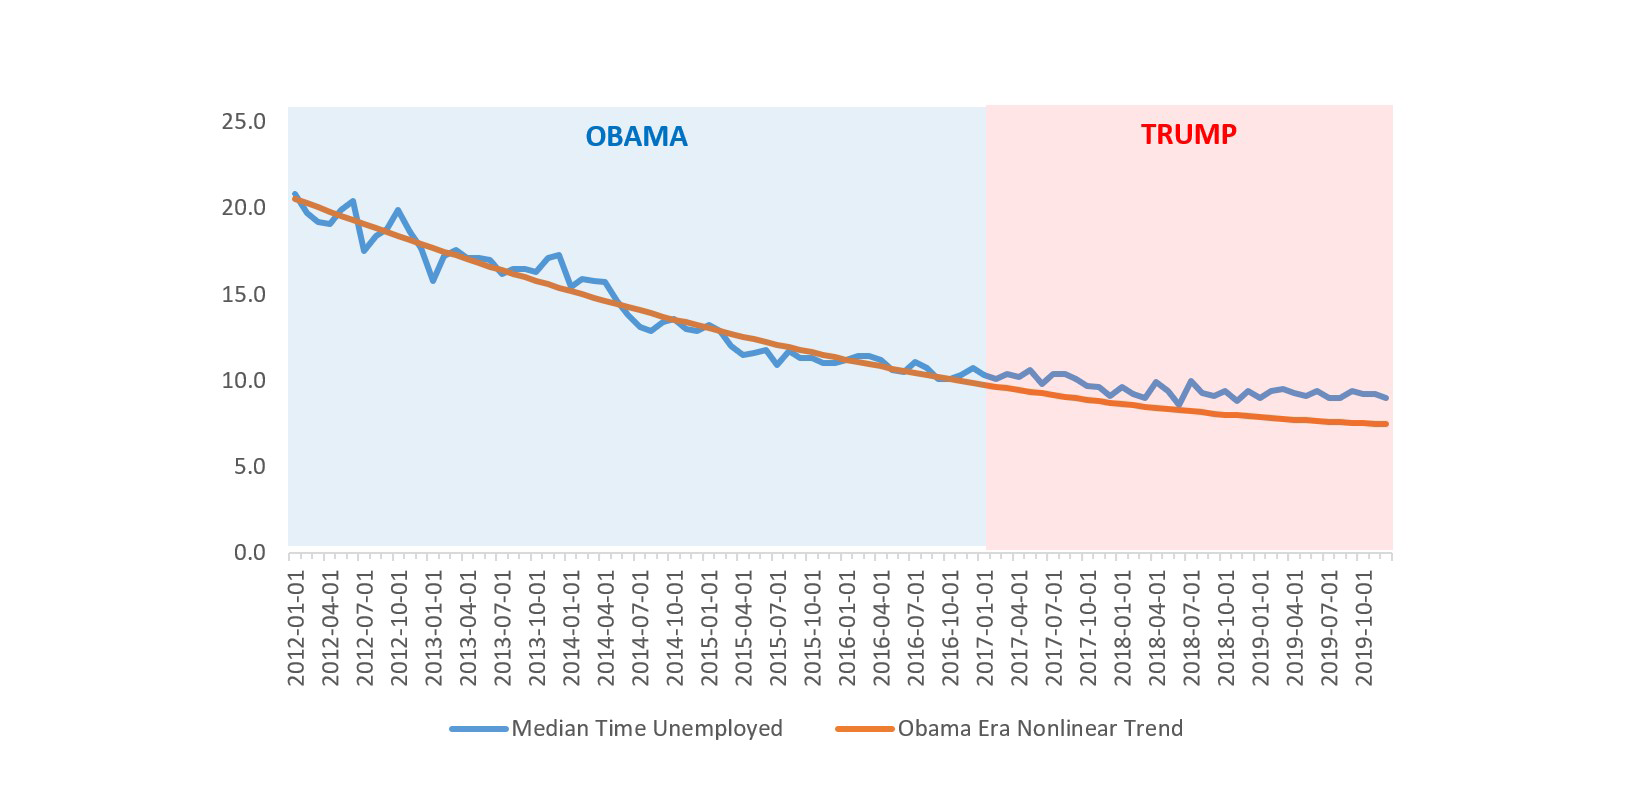
Figure 4: Curvilinear trend in the median weeks unemployed during the last five years of the Obama administration, projected into the first three years of the Trump administration (data source).
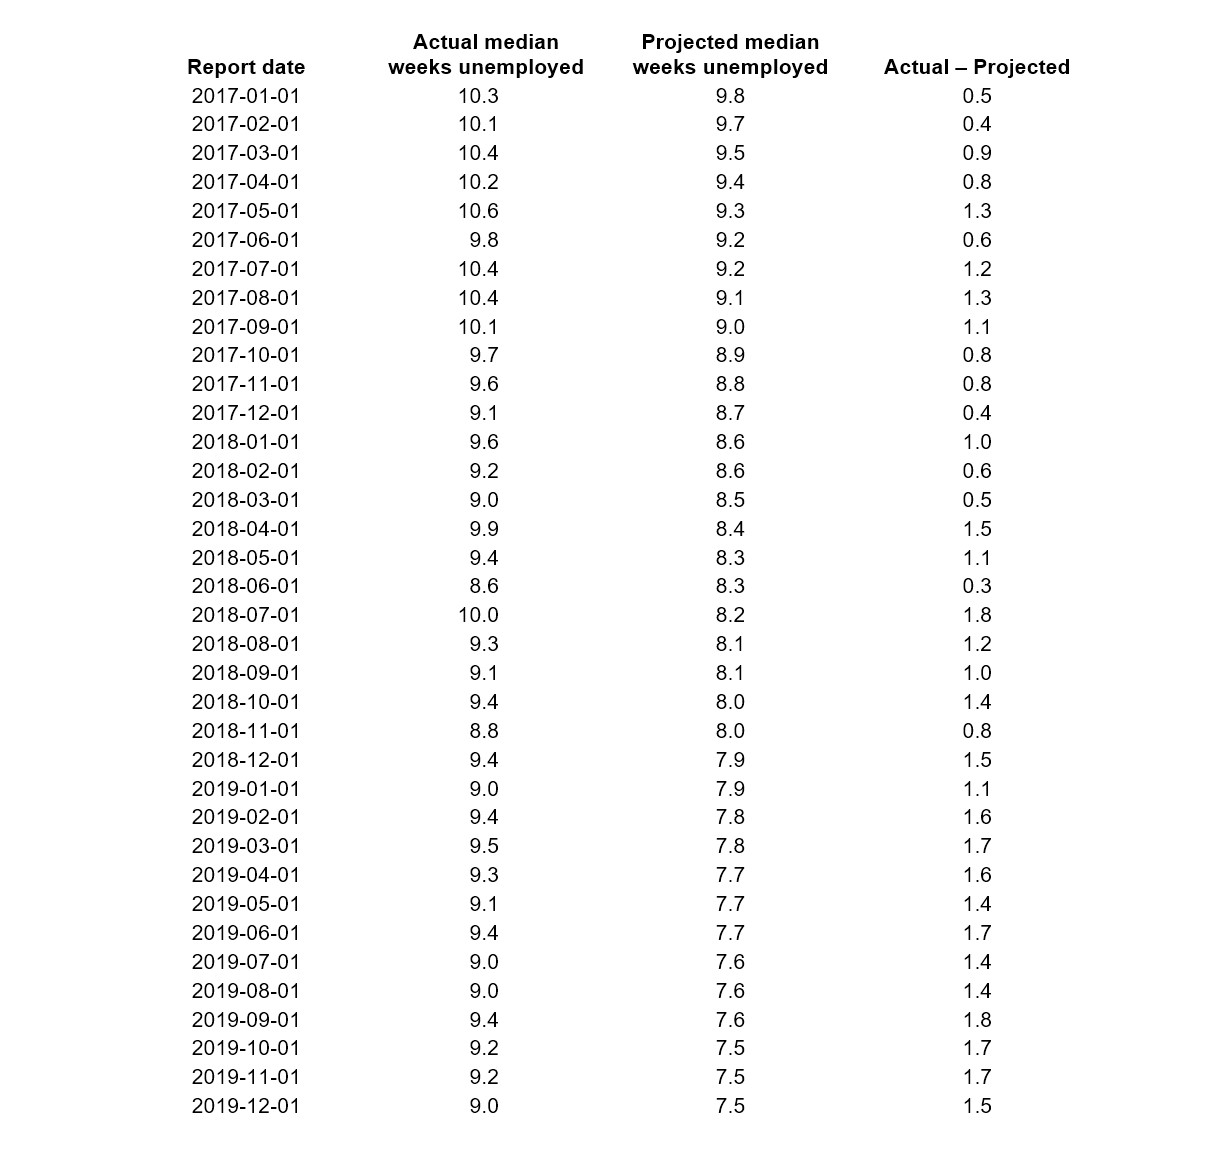
Figure 4 shows that when we project the curvilinear trend established during the Obama administration into the first three years of the Trump administration, the Trump administration consistently failed to maintain the trend in reduction in the number of weeks unemployed. Table 4 provides the corresponding values.
Table 4: Actual and projected quarterly median weeks unemployed during the first three years of the Trump administration.
Inflation rate
The inflation rate, a measure of the change in the prices paid by consumers for goods and services over time, provides information on the relative value of a given amount of money in exchange for commodities and services. The resulting linear trend regression model for the monthly inflation rate estimated over the last five years of the Obama administration is ŷt = 0.1288 + 0.00006t, where ŷt is the estimated inflation rate in month t. This model indicates that the last five years of the Obama administration established a virtually constant monthly inflation rate of 0.13%. That is, prices in the US generally increased extremely slowly during the last five years of the Obama administration.
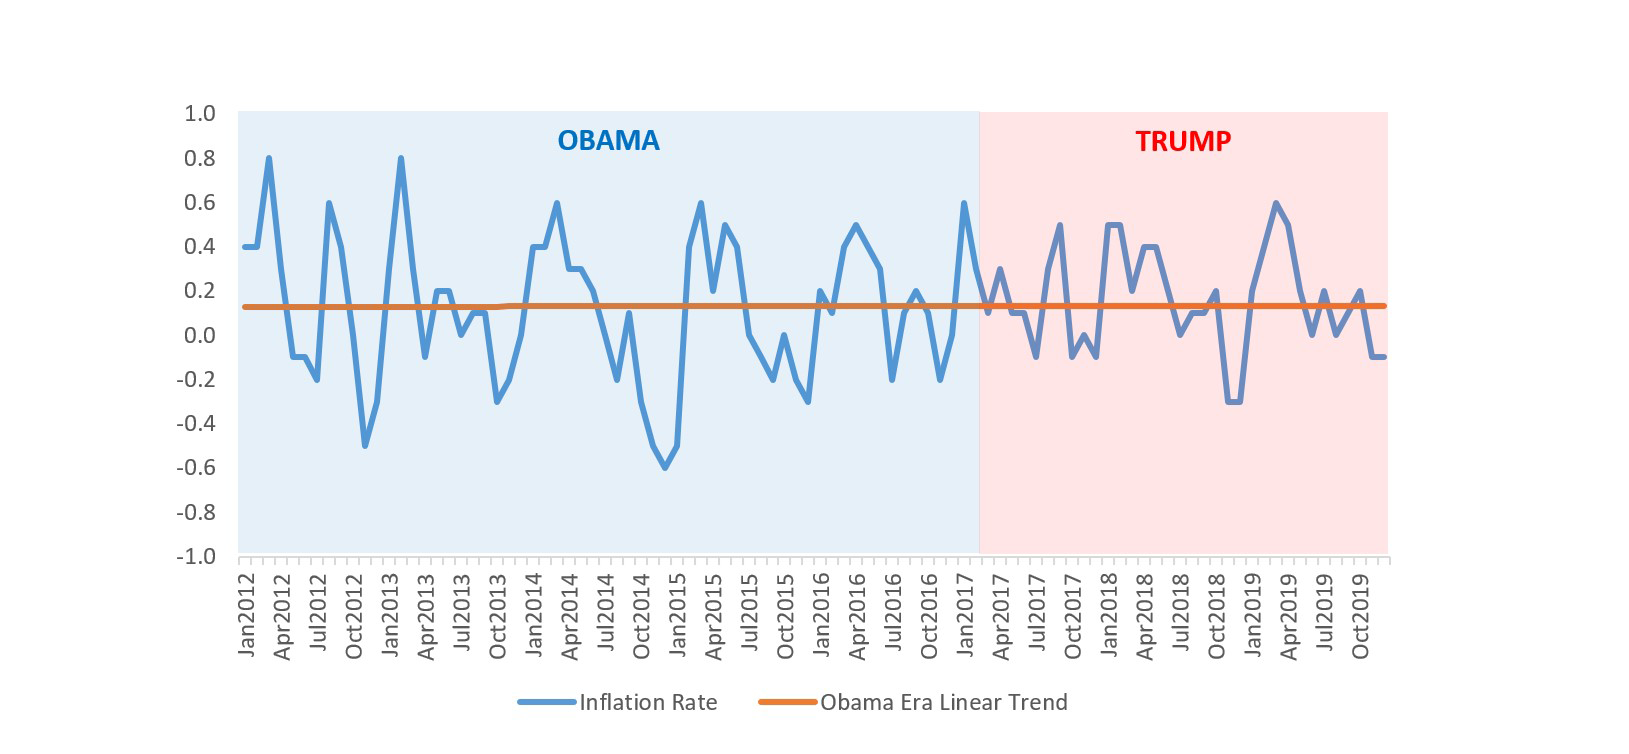
Figure 5: Linear trend in the monthly inflation rate during the last five years of the Obama administration, projected into the first three years of the Trump administration (data source).
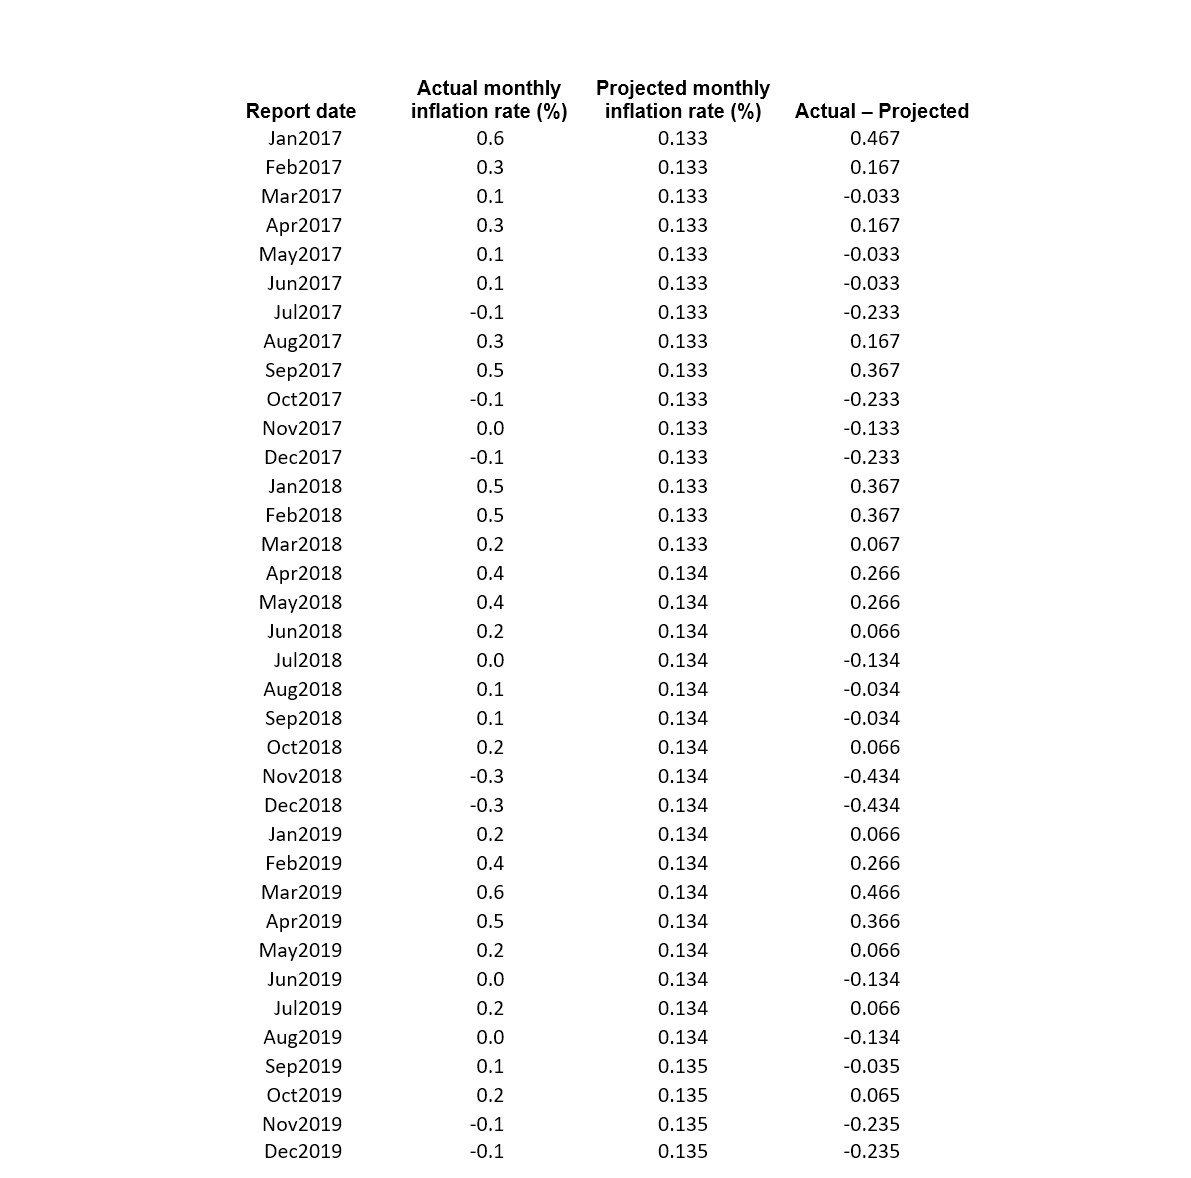
Figure 5 shows that when we project the linear trend established during the Obama administration into the first three years of the Trump administration, we see that the Trump administration has experienced slightly greater inflation than the Obama era trend. Table 5 provides the corresponding values.
Table 5: Actual and projected monthly inflation rate during the first three years of the Trump administration.
Dow Jones Industrial Average
The Dow Jones Industrial Average (DJIA), a price-weighted index that tracks 30 large, publicly-owned companies trading on US stock exchanges, is a key barometer of the health of US business and industry and the wealth of investors. The resulting linear trend regression model for the DJIA daily closing value estimated over the last five years of the Obama administration is ŷt = 11603.86 + 7.53t, where ŷt is the estimated DJIA closing value on day t. This model indicates that the last five years of the Obama administration established a growth rate of 7.5 points per day.
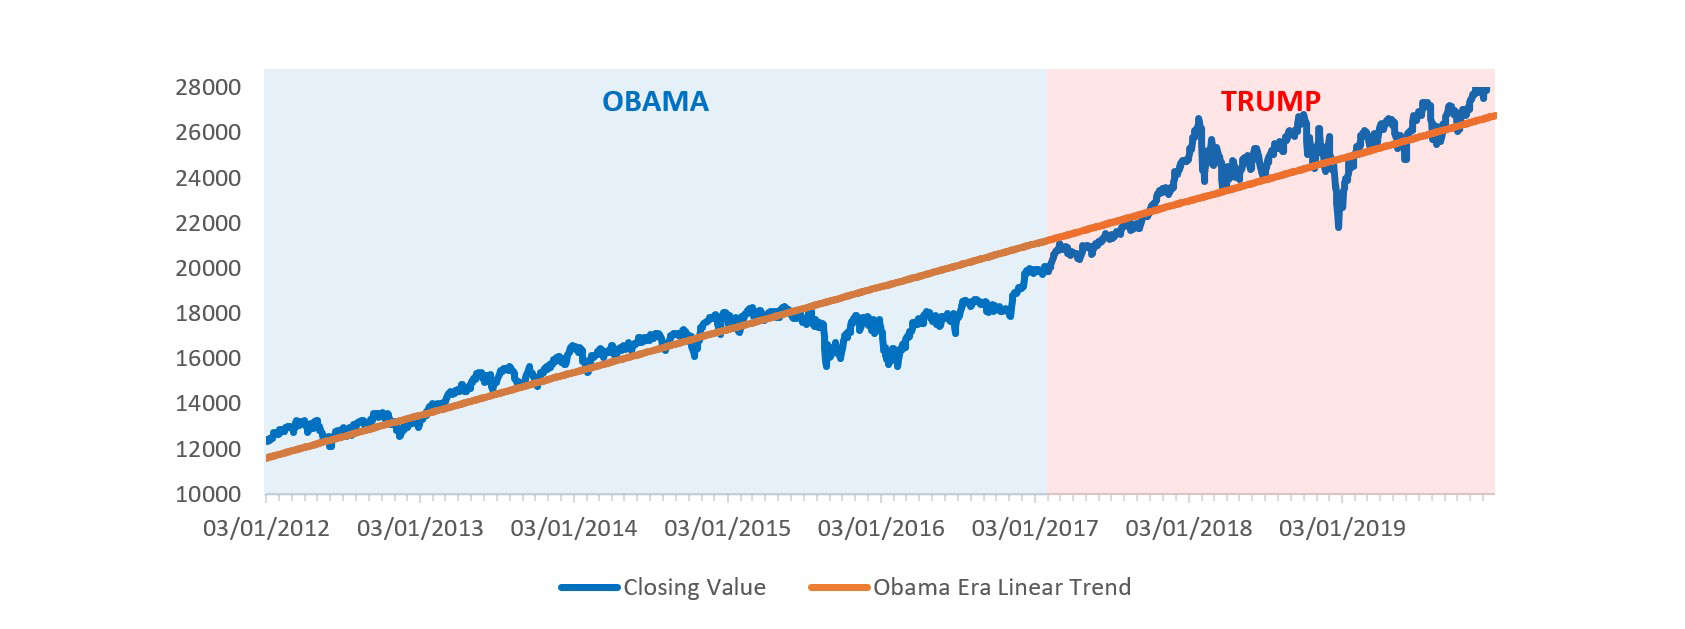
Figure 6: Linear trend in the daily DJIA closing value during the last five years of the Obama administration, projected into the first three years of the Trump administration (data source).
Figure 6 shows that when we project the linear trend established during the Obama administration into the first three years of the Trump administration, we see that the Trump administration has generally achieved slightly higher closing values overall for the DJIA. Note also in Figure 6 that the horizontal axis intersects the vertical axis at 10,000 rather than 0; although this exaggerates the differences between the actual values and the trend line, we do so to better enable the reader to see the differences on the graph.
Conclusions
Relative to the trends established during the last five years of the Obama administration, the Trump administrations has:
- overperformed slightly with respect to GDP
- underperformed slightly with respect to net change in jobs
- performed as expected with respect to unemployment
- underperformed with respect to number of weeks unemployed
- underperformed slightly with respect to inflation (and on this measure of economic performance, it is difficult to say at these levels if this outcome is positive or negative)
- overperformed slightly with respect to the DJIA
Overall, the economic performance of the Trump administration during its first three years follows the trends established by the Obama administration in its last five years remarkably closely. The results of these simple analyses suggest Kudlow’s claim that Trump inherited a stagnant economy on the front end of recession and his assertion that Trump rebuilt the economy in three years are suspect. However, it could well be that after considering differences in economic conditions between the last five years of the Obama administration and the first three years of the Trump administration, one might conclude that maintaining these economic trends during the ensuing three years has been a resounding success, an abysmal failure, or anywhere in between these two extremes.
Given how closely economic performance during the first three years of the Trump administration follows the trends established during the last five years of the Obama administration, claims that the economy during the pre-pandemic Trump administration outperformed the economy during the last five years of the Obama administration cannot be considered valid unless they are supported by an explanation of how factors for economic growth were more favorable during the last five years of the Obama administration and/or less favorable for economic growth during the first three years of the Trump administration. Such an assessment would require a far more sophisticated analysis of the US economy and is far beyond the scope of this article.
About the author
James J. Cochran is associate dean for research, professor of applied statistics, and the Rogers-Spivey faculty fellow at the Culverhouse College of Business, University of Alabama. He is vice-chair of the Significance Editorial Board.


