
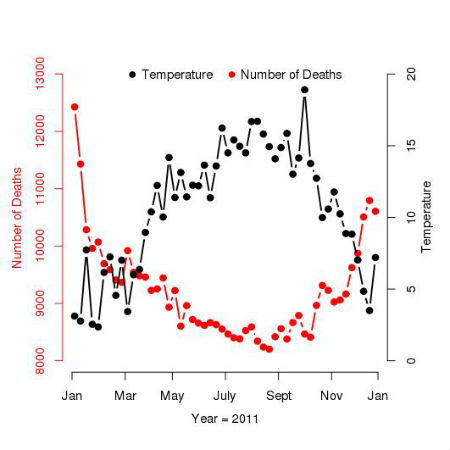
Recently we noted here that there is a strong seasonal pattern in mortality in England and Wales with the number of deaths rising sharply in the winter months. The figure below shows the number of deaths (using the left-hand axis) and the average temperature (using the right-hand axis) for each week in England and Wales in 2011.
The figure shows that there were around 12500 deaths in the first week of 2011 but only around 8500 deaths per week during the summer months. Unsurprisingly, the average temperature follows a trend which is nearly the inverse of that followed by the number of deaths, and looking at the variation throughout the year in the number of deaths and the average temperature, it might seem clear that rising winter mortality is due to the cold.
Researchers have found it hard, however, to agree on the exact relationship between temperature and mortality. The main problem is that temperatures vary in a fairly regular way throughout the year so trying to isolate the effects of temperature from calendar variations in other causes of mortality is bound to be difficult. In particular, the number of deaths from flu and respiratory illnesses rises in the winter months and, as we noted previously, difficulty in accessing medical care may be a factor leading to the peak in the number of deaths at the New Year. If we want to isolate the effect of temperature on mortality it is necessary to try to control for the effect of seasonal factors, however, but our ideas about how to measure them tend to be a little vague. The most common approach to removing the effect of seasonal factors on mortality has therefore been to identify them with a smooth trend in the number of deaths throughout the year and to identify the effect of temperature on mortality from how the number of deaths departs from the smooth trend in response to short-term fluctuations in temperature.
One way to model smooth variation in the number of deaths throughout the year is to include linear and quadratic time terms as explanatory variables in a statistical model. The variation in the predicted number of deaths throughout 2011 using this model is plotted as the black line in the figure below. Although the quadratic time trend picks out the general variation in mortality throughout the year, it does not fit the observed data particularly well over the spring and autumn months.
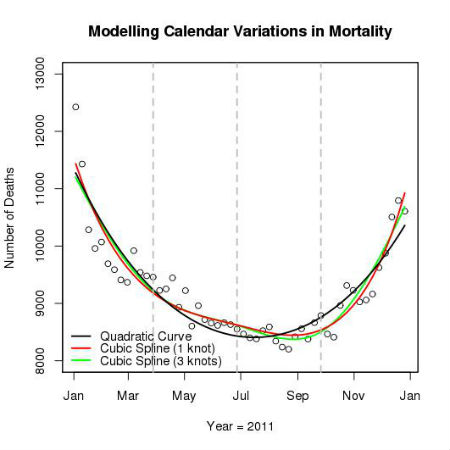
A useful way of introducing greater flexibility to modelling the seasonal trend is to use a piecewise cubic function (termed a spline) which can adjust to the shape of the underlying relationship. The flexibility with which a spline fits a trend is determined by the number of points at which the shape of the function is allowed to change (these are termed knots) and it is usually necessary for the researcher to specify the position of the knots in advance. The red line in the figure above shows the predicted trend in the number of deaths using a spline with a single knot placed at the last week in June (marked by a vertical dashed line). In this model the trend in mortality between January to June is modelled using one function of time, time-squared and time-cubed and the trend from July to December is modelled using a separate (although closely related) function. The figure also shows the predicted number of deaths from a model using three knots (the green line) which are placed at the end of March, the end of June and the end of September (the vertical dashed lines). The trend from the spline using three knots is quite close to that from the spline using a single knot, but appears to provide a slightly better fit to the data over the autumn months.
The aim of using a spline to model calendar variations in mortality is to have a term in a model that fits the smooth trend in the number of deaths throughout the year reasonably well. The exact shape of the relationship is usually not really of interest as long as it fits the data relatively closely, leaving us to study the interesting trend, between temperature and mortality, in greater detail. In practice, however, researchers have found it difficult to choose the degree of flexibility (or the number of knots) to allow in the model for seasonal variations in mortality. The more knots that we include in the spline the closer we are able to fit the observed data, however, inlcuding too many knots carries the risk of including in the spline short-term fluctuations in the number of deaths that we think are probably due to changes in temperature.
Published studies use daily data on mortality and model seasonal variations using a spline with 5 or 6 knots per year. The results from these studies seem to suggest that the effect of temperature on mortality is relatively small after removing seasonal variations in mortality. As I mentioned above, this might seem a surprising result but it is usually interpreted as telling us that the rise in deaths during the winter is not really due to the change in temperature but to factors correlated with temperature which also affect mortality. For those at risk, particularly the elderly, it would seem a good idea to have a flu jab.


