Pandemic swine-flu, which emerged from Mexico in spring 2009, was a wild thing but a mild thing: H1N1 claimed fewer than 500 lives in the UK.1 Nonetheless, the severity of its third wave in winter 2010/11 alarmed intensive care specialists.
In June 2009, Andrew Pelling MP posed parliamentary questions to uncover the hitherto-undisclosed age distribution of the UK’s initial 1,052 H1N1 cases, as confirmed by 16 June 2009. Modal age-groups were 20-29 years (63: 32%) and 30-39 years (35: 18%) for the 195 cases whose H1N1 infection was imported (e.g. returned from vacation or work in Mexico). But the modal age groups were considerably younger for the 435 cases whose transmission was known to have occurred within the UK: 10-19 years (189: 43%) and under 10 years (136: 31%); and about as young for 422 cases whose exposure route was unknown.
Pelling’s questions were important ones to ask and answer: age matters for both the transmission and severity of any respiratory infection, and the age-distribution of imported cases is likely to differ from when within-country transmission becomes established.
Now skip forward to the present pandemic. On 13 March 2020, Philip Hollobone MP tabled a question about the age-distribution for the UK’s (a) first 200, (b) second 200, (c) third 200 and (d) fourth 200 Covid-19 cases by sample date – that is, the date when a sample was collected from the patient for testing. The depressing answer was: “Data on the Covid-19 cases in the United Kingdom are not available in the format requested”.
To age or not to age?
Unlike with swine-flu, the UK has published no information on how the age distribution of Covid-19-positive cases has evolved over time. A shift in the age distribution would be expected, not least on account of interventions made to reduce both exposure to and transmission of the virus. The UK’s cocooning for 12 weeks of vulnerable individuals and of all persons aged 70-plus years, together with hand-washing, social distancing and, as of 23 March 2020, a three-week lockdown (since extended until at least early May) are intended to minimize transmission.
Two key lessons should have been learned from H1N1:
- Demography (age, sex, location) matters in any respiratory infection epidemic.
- The reporting of test results by sample date, not by report date, is essential if we are to track reliably how Covid-19 is spreading through the population. The problem with using data based on when a test is reported, rather than taken, is that the filing date is affected by test capacity, prioritization of whom to test first (test route) and, initially, because all positives had to be confirmed independently by a national reference laboratory.
In February 2020, the UK’s antigen testing of the SARS-CoV-2 virus had focused on imported cases and their contacts. Test performance, let alone the age distribution of those being tested, may be somewhat different after the UK’s antigen testing routes shifted to be primarily: (i) hospitalized patients suspected of having Covid-19, for case management and ward assignment; (ii) suspected symptomatic cases in the households of quarantined healthcare workers (HCWs), or HCWs themselves, to facilitate HCWs’ early return to work if the suspected case is negative for Covid-19 (HCWs are among our most critical workers); and (iii) suspected symptomatic cases in the households of quarantined key workers (KWs), or KWs themselves, to facilitate KWs’ early return to work.
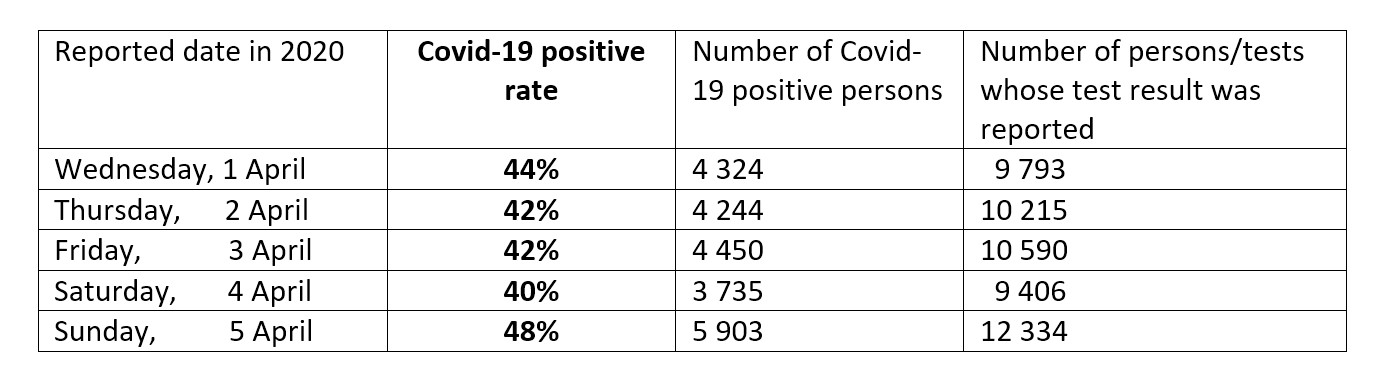
Not even by 1 April 2020 were the UK’s antigen test results being reported in the public domain separately for test routes, by sample date and by age group (let alone also gender). Muddled by test route, age group, the switch from reporting of tests to reporting of persons tested, and by reporting delays, the UK’s Covid-19 positive rates, each highly precise (with a standard error of 0.5%) on a day-to-day basis have varied incredibly between report dates; see Table 1. Reporting by test route (or “pillar”) has since been instituted. Unfortunately, one of said pillars combines – rather than separates – the results for (i) and (ii) above.
The importance of reporting by sample date (and by death date; more of which below) were among key issues raised in the Royal Statistical Society’s written and oral evidence to the House of Commons Science and Technology Select Committee’s Inquiry into Scientific Advice in Emergencies.
TABLE 1 Huge unexplained variation in UK’s Covid-19 positive rates – given that each standard error is around 0.5%.
To date or not to date?
The UK government’s focus so far has been on the more severe manifestations of Covid-19:
- hospitalizations (although, whether these are new Covid-19 admissions or Covid-positive persons in hospital is unclear);
- admissions to, and length of stay in, intensive care units; and
- daily reporting on hospital-based deaths of persons testing positive for Covid-19.
Meanwhile, the Office for National Statistics (ONS) publishes a weekly report for England and Wales on registered deaths in which Covid-19 is mentioned on the death certificate. Data are reported by week of registration, age group and gender, but also by week of death. Adjustment for registration delays is to follow shortly.
Registered deaths in which Covid-19 is mentioned on the death certificate include, for example, deaths in residential care homes and deaths of people whose preference was to die at home. The indirect impact of the Covid-19 pandemic on all-cause mortality is also being monitored weekly, including by comparison against expected deaths on the basis of the past five years (see here for data from Scotland). This is especially important for the very old (aged 85-plus). Whereas death registrations mentioning Covid-19 (2,163) were about one third as many as non-Covid deaths (6,840) at ages 55-84 years, the percentage dropped to just 22% for the very old in England and Wales, for whom a total of 6,428 deaths were registered in the week to 3 April 2020, but only 1,163 had Covid-19 mentioned on the death certificate.
As with delays in death registrations, delays in the reporting of hospital-based Covid-19 deaths are inevitable. But such delays need to be acknowledged publicly to enable hospitals to work out local solutions for limiting them and to see how successful their efforts have been.
Most importantly, the impact of reporting delays needs to be seen to have been taken into account, for example, by the expected total for each of the more recent death dates being qualified by an uncertainty interval. Regrettably, the charts that are displayed at the UK government’s daily press conferences for tracking the evolution of the UK’s hospital-based Covid-19 deaths do not take substantial reporting delays into account as no uncertainty intervals are in evidence. In charts that plot Covid-19 deaths by death date, the latest death counts would appear anomalously low, as only 16% of daily reports relate to Covid-19 deaths which occurred on the preceding day in English hospitals.
The delay in reporting Covid-19 deaths in English hospitals was first disclosed on 26 March 2020 when the information released included the death dates for each hospital’s reported Covid-19 deaths. To understand the impact of this delay, I worked through each day’s paper listing to compile the reporting delay distribution shown in Table 2 for death dates from 25 March to 1 April 2020. (From 3 April, the death dates for each day’s reports have been provided by the NHS not only for “All England” but by region and by broad age-group. This much-improved reporting standard is hugely welcome) Corresponding data for Wales are not in the public domain.
TABLE 2 The count of deaths on a particular report date includes deaths that have occurred during the previous 10 days and earlier still. Transparency about reporting delays enables hospitals to work out local solutions. Hospitals can’t solve hidden problems.
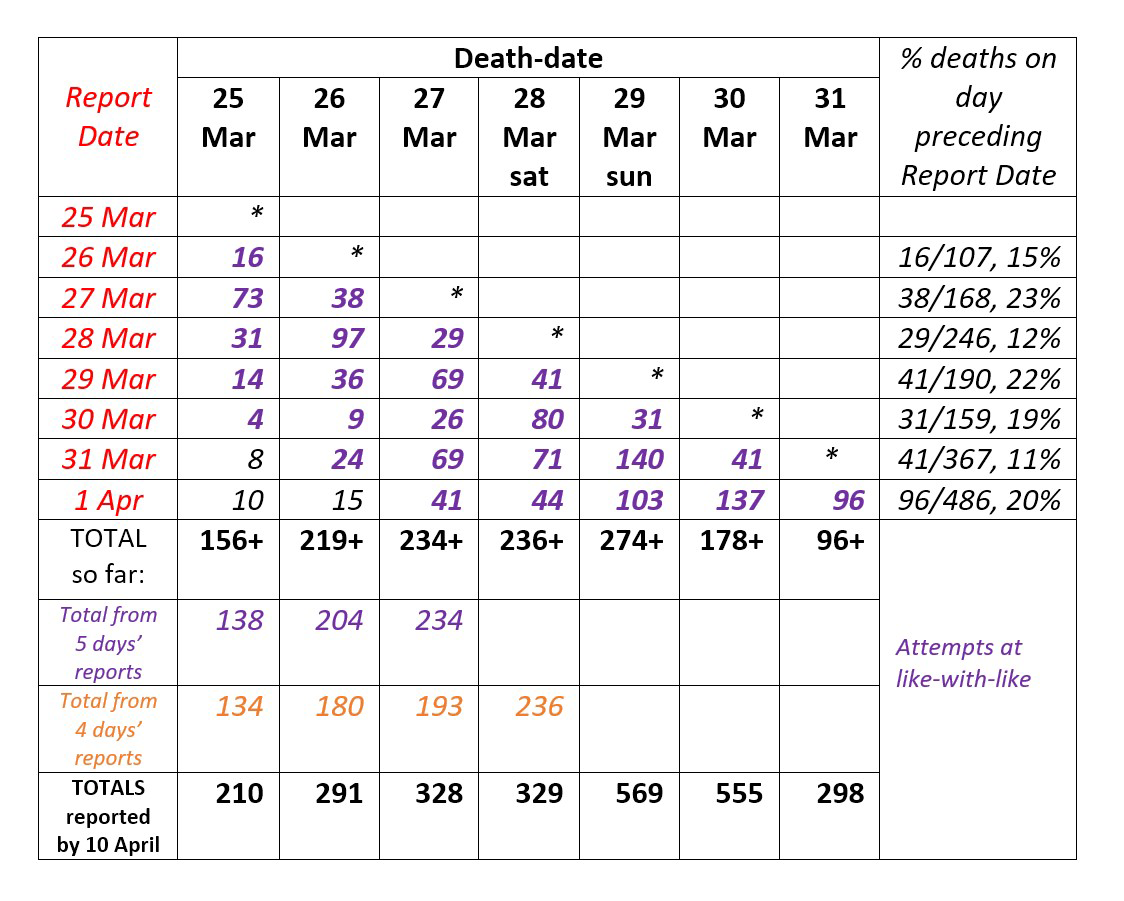
Reporting delay has a massive effect. On 31 March, English hospitals reported 367 Covid-19 deaths which the press – and perhaps even ministers – assumed pertained primarily to deaths that had occurred on 30 March 2020, seven days after the UK’s lockdown began. In fact, only 41 of those Covid-19 deaths had occurred on 30 March 2020. Even crude adjustment for reporting delay suggested that by the report date of 10 April, we’d have accumulated around 700 reported COVID-19 deaths (uncertainty: 640 to 780) pertaining to 30 March 2020. The cumulative total for 30 March, as reported on/before 10 April was 555.
Proper exploitation of the reporting delay distribution can estimate (with widening uncertainty) the number of deaths which occurred up to yesterday. For instance, a technique known as “now-casting” self-adjusts for changes in the reporting pattern (see here for an example using Covid-19 data).2
All of this is in stark contrast to Scotland, where Covid-19 test samples have associated with them not only a sample date but also the Community Health Index (CHI) number of the person tested. All deaths in Scotland are also CHI-identified, as are hospitalisations, so that record-linkage studies for “virtual” cohorts of Covid-19 tested individuals are enabled.
Powerful antibody surveillance required
Attempts in 2010 to track H1N1 antibody prevalence by age group and region were handicapped by inadequate sample numbers and a scramble to recruit additional laboratories from which to obtain samples, with the result that comparisons were not like-with-like.3
SARS-CoV-2’s lethality, our uncertainty about the extent of asymptomatic infections (including in children) and whether we are capable of engendering an antibody response, together with needing to determine the duration of antibody response, demand that priority be given for a mesh of surveillance studies (as shown in Table 3) – provided that affected humans do form neutralizing antibodies.
TABLE 3 Mesh of Covid-19 antibody surveillance studies, illustrated for Scotland.
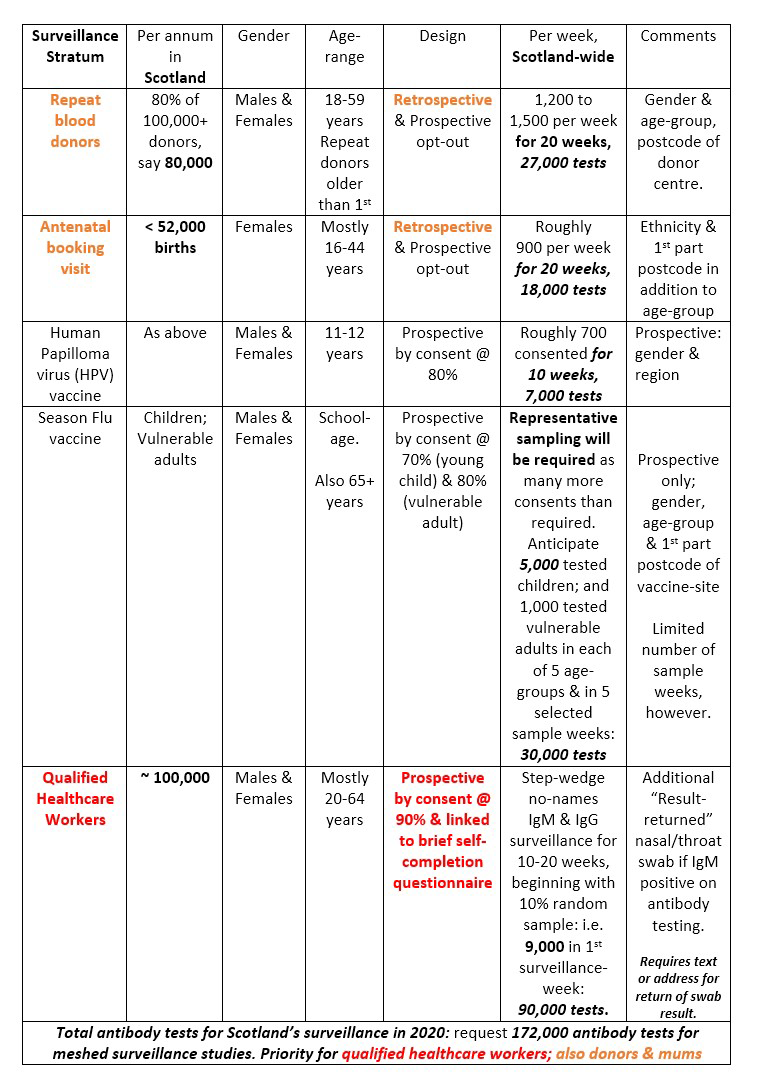
Well-designed, geographically-representative, powerful and practicable antibody prevalence studies in different sections of the population should be partially overlapping in at least some of the following characteristics: age groups, gender, location and repeatability. For example, repeat blood donors and antenatal women give repeated blood samples: six-monthly in the case of UK blood donors, and at booking visit, 28 weeks and delivery for expectant mothers.
At least some antibody prevalence studies should have an associated brief self-completion questionnaire about whether the participant thinks that they definitely/probably/possibly had Covid-19 and, if so, they should be asked to complete a symptom checklist. Immunization times present an opportunity to recruit both children and vulnerable adults into surveillance.
Disappointing news in early April is that many leading-contender antibody tests have not passed muster by criteria for diagnostic use. However, although salivary testing for Hepatitis C virus (HCV) in the late 20th century was not adequate for making HCV diagnoses, salivary testing served perfectly well for HCV surveillance in prisons as “correction” could be made for test performance.4
Test-adequacy for population surveillance should be an evaluation-criterion when appraising Covid-19 antibody tests.
References
- Presanis, A. M., Pebody, R. G., Paterson, B. J. , Tom, B. D. M., Birrell, P. J., Charlett, A. and Lipsitch, M. (2011) Changes in severity of 2009 pandemic A/H1N1 influenza in England: a Bayesian evidence synthesis. British Medical Journal, 343, d5408. ^
- Harnau, J. and Nielsen, B. (2018) Over-dispersed age-period-cohort models. Journal of the American Statistical Association, 113, 1722 – 1732. ^
- Bird, S. M. (2010) Like-with-like comparisons? The Lancet, 376, 684. ^
- Gore, S. M., Bird, A. G., Cameron, S. O., Hutchinson, S. J., Burns, S. M. and Goldberg, D. J. (1999) Prevalence of Hepatitis C carriage in Scottish prisons: Willing Anonymous Salivary Hepatitis C surveillance linked to self-reported risks. Quarterly Journal of Medicine, 92, 25 – 32. ^
About the author
Sheila M. Bird is formerly programme leader at the MRC Biostatistics Unit, Cambridge University. She is a member of the Significance editorial board and the Royal Statistical Society’s Covid-19 Task Force.


