
The World Health Organization asks governments to consider two questions when carrying out risk assessments for adjusting public health and social measures in the context of Covid-19. First, is the public health system able to identify, isolate, and care for cases and quarantine contacts? Second, is the public health system able to rapidly detect a resurgence of cases?
To answer both questions affirmatively, governments need to have appropriate swab-testing procedures in place. For Covid-19, samples are collected from the back of a person’s nose and throat (a nasopharyngeal swab) in order to test for the presence of the SARS-CoV-2 virus.
In the UK, such testing procedures are in place. But the reporting of test results leaves much to be desired. Important truths and inferences are being hidden behind the government’s swab-testing “pillars” (see Figure 1).
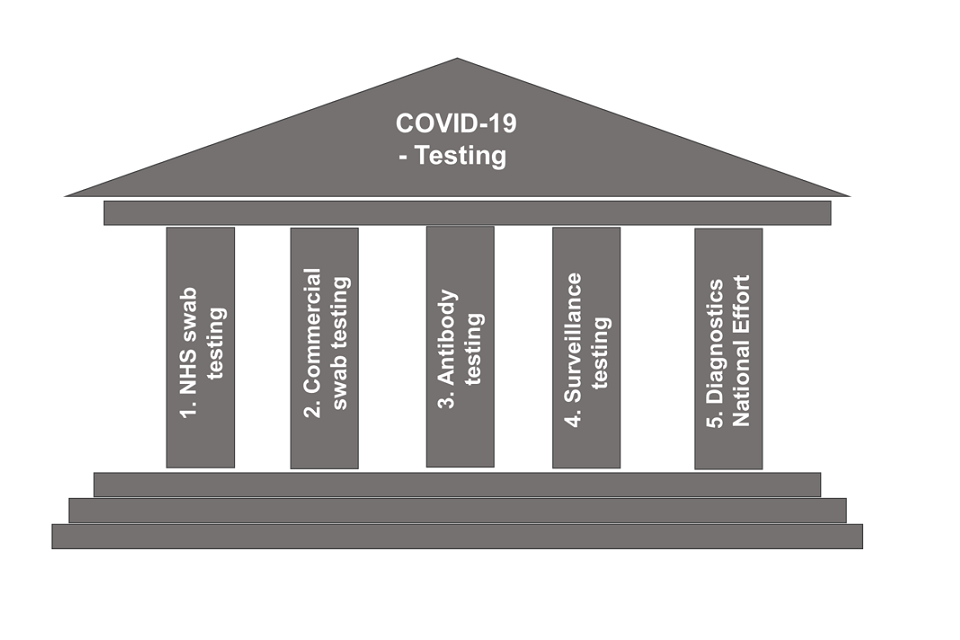
FIGURE 1 UK government graphic showing its Covid-19 testing “pillars”: (1) NHS swab testing; (2) Commercial swab testing; (3) Antibody testing; (4) Surveillance testing; (5) Diagnostics National Effort. Source: Department of Health and Social Care
Most problematic of all is pillar 1 which supports three different tiers of testing:
- Pillar 1, tier 1 comprises swab tests for patients on account of medical need, which are essentially performed in hospitals;
- Pillar 1, tier 2 comprises swab tests for our most critical workers (i.e. doctors, nurses);
- Pillar 1, tier 3 is swab-testing for the family/household member(s) of our most critical workers who are in quarantine on account of a family/household member who suspects they have, or is showing symptoms of, Covid-19.
Under tier 1, any given patient is liable to be tested more than once – even three or four times between admission and discharge. But those in tiers 2 and 3 are generally administered only a single swab test per person.
The mystery is why swab test results for tiers 2 and 3 are reported together (along with tier 1) – rather than separately – since there are potentially more direct exposure routes for critical workers than for their family/household members.
The same disaggregation concern applies to pillar 2 swab-testing, which covers “critical key workers in the NHS, social care and other sectors”. Again, the UK government fails to distinguish between Covid-19 positive rates for quarantined key workers versus their family/household member(s).
What is required is insightful public accounting, weekly, for numbers of our most critical workers who have been swab-tested in pillar 1, tier 2 and the percentage of them who tested positive for Covid-19. Accounting should be by sample date, which is the pandemic’s time scale (not result date) and should include subdivision by age group and gender of those tested.1,2 (See Public Health England’s infographic.)
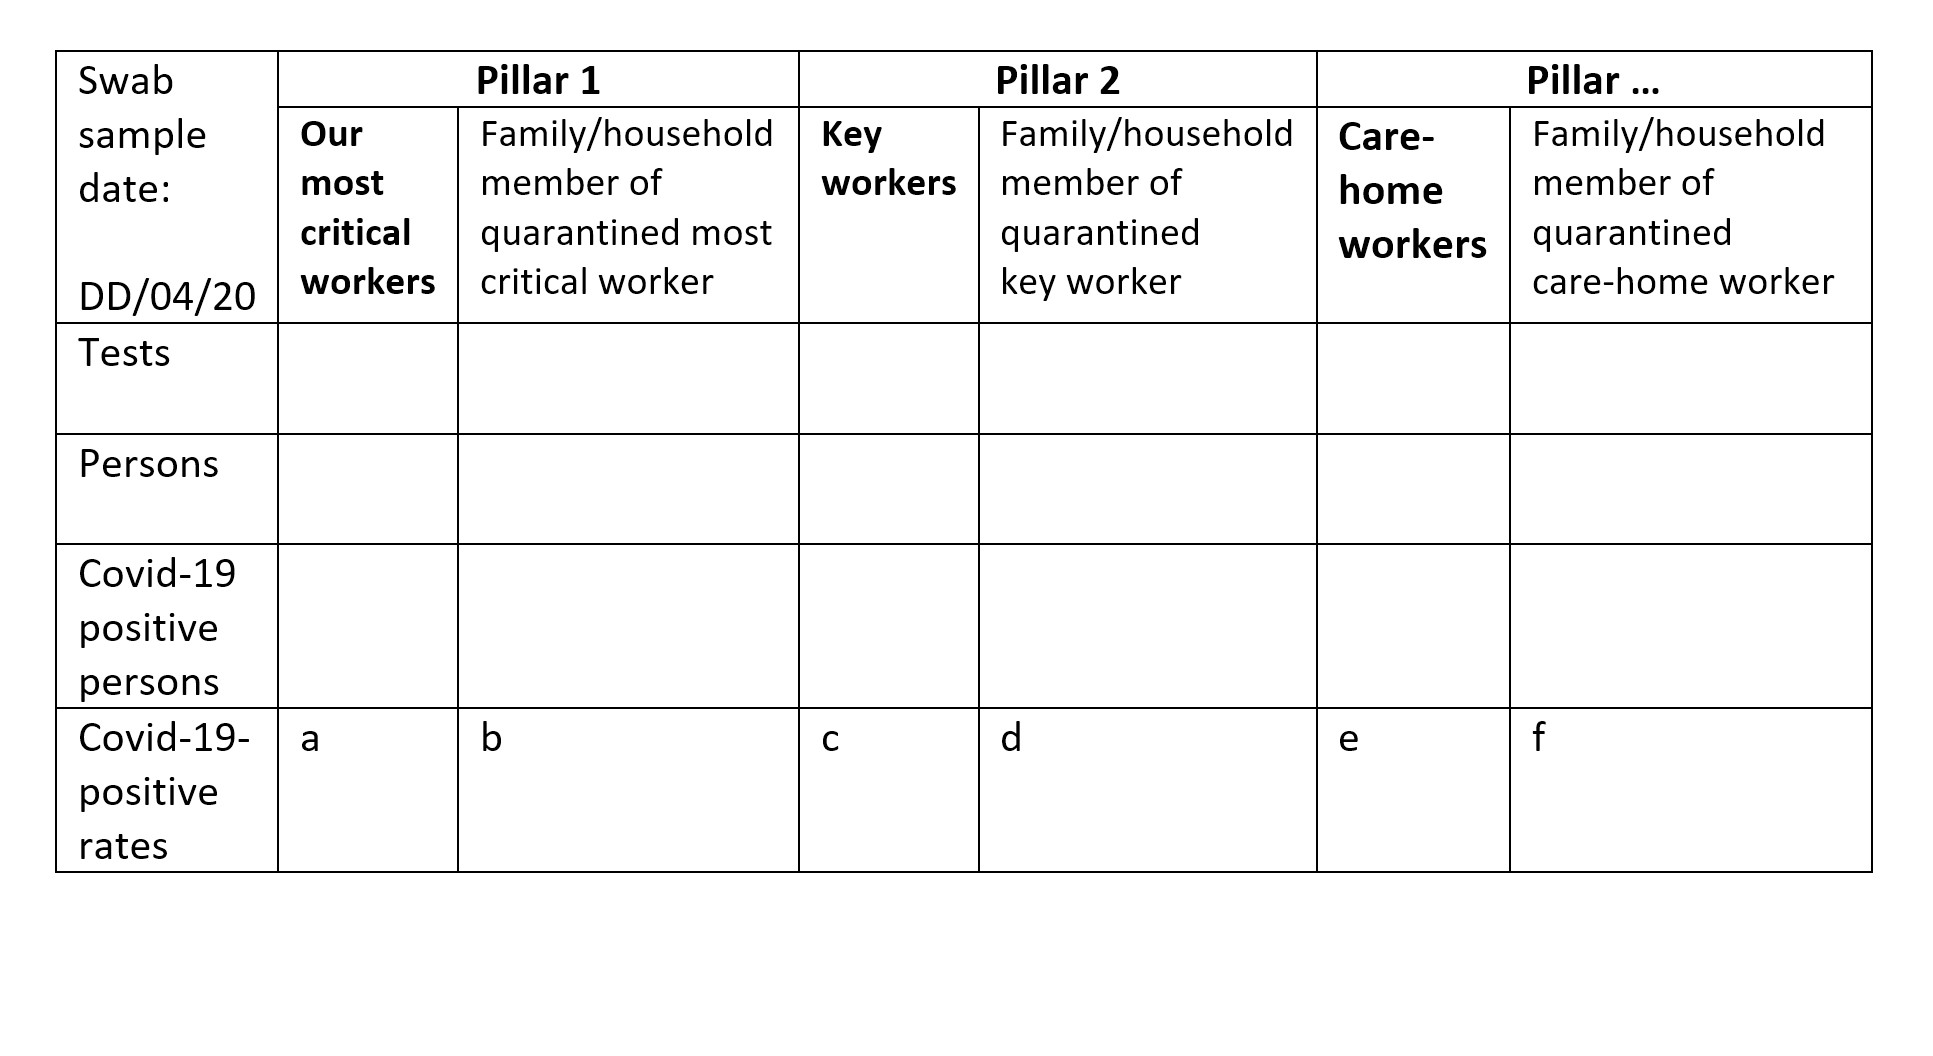
Separately, but currently lacking,1 there should be the same standard of interpretable public accounting, weekly, for the number of persons who have been swab-tested in pillar 1, tier 3 (because their illness has resulted in quarantine for a most critical worker) and the percentage of them who tested positive for Covid-19. And similarly for pillar 2 (see Table 1 for an example reporting template).
TABLE 1 An example reporting template, by sample date, for the number of tests, the number of persons tested and the numbers and rates of Covid-19 positive results.
Understanding test patterns
Another aspect of swab test results that is important to report and investigate is the pattern of test results for recovering patients in pillar 1, tier 1. Typical 3-test and 4-test patterns might include:
- Positive, negative, negative
Here the double negative is for clinical reassurance that a recovering patient is no longer infectious and can be discharged home, or at least from the Covid ward. - Negative, positive, negative, negative
Contrary to clinical diagnosis, the patient’s initial swab test is negative and was repeated. This apparent false negative may be due to an insufficiently deep initial nasal and throat swabbing technique, rather than test sensitivity (the true positive detection rate).
Since a recovering patient’s hospital stay may extend for two to three weeks (or even longer), the patient’s test pattern may be incomplete at 6 and even 20 days after the patient’s first swab sample-date during hospitalisation. Unless great care is taken to track serial tests for the same patient, which would typically occur on different sample dates, at least two filing dates are likely for the above 3-test pattern.
Consider, for example, that on the first filing date, the laboratory might report: 1 test, 1 person, 1 positive. Intelligently, the laboratory may wait for the second of the two negative tests before filing the two negative tests together on a second date as: 2 tests, 1 person, 0 positive. Were we then naively to sum the laboratory’s two filed reports, we’d mistakenly conclude: 3 tests, 2 persons, 1 positive.
If this pattern were repeated 100 times, we would end up with: 300 tests, 200 persons, 100 positive. We would mistakenly assume that 50% of the persons tested were positive for Covid-19, whereas all (100%) of the 100 hospitalised persons (not 200 persons) with the above 3-test pattern in pillar 1, tier 1 were positive for Covid-19.
The error here is the failure to anticipate logical clinical and laboratory practice. Failure to think ahead when designing a data collection scheme leads to nonsense reporting standards whereby summation of the reports, if filed daily by laboratories, can lead to serious misrepresentation of swab-test positivity per person tested on account of medical need.
How can such a difficulty be resolved? One possible solution is to file per-patient test patterns according to first swab sample-date as follows. File first when a patient within pillar 1, tier 1 has reached “first swab sample-date plus 6 days” (period 1). File second (and last) when a patient within pillar 1, tier 1 has reached “first swab sample-date plus 20 days” (period 2).
Four tests in just 7 days (period 1) are unlikely. Additional filing delay of two days may be necessary for all swab samples received within the stated period to have been analysed.
Table 2 illustrates how to report, by first swab sample-date, 7-day test-patterns in cases of medical need. The entries are my guesstimates, illustrated for 1,000 7-day test-patterns.
TABLE 2 An example of how to report, by first swab sample-date, 7-day test-patterns in cases of medical need, allowing for multiple swab samples per hospitalised patient within 6 days of the patient’s first hospitalised swab-sample date (pillar 1, tier 1).
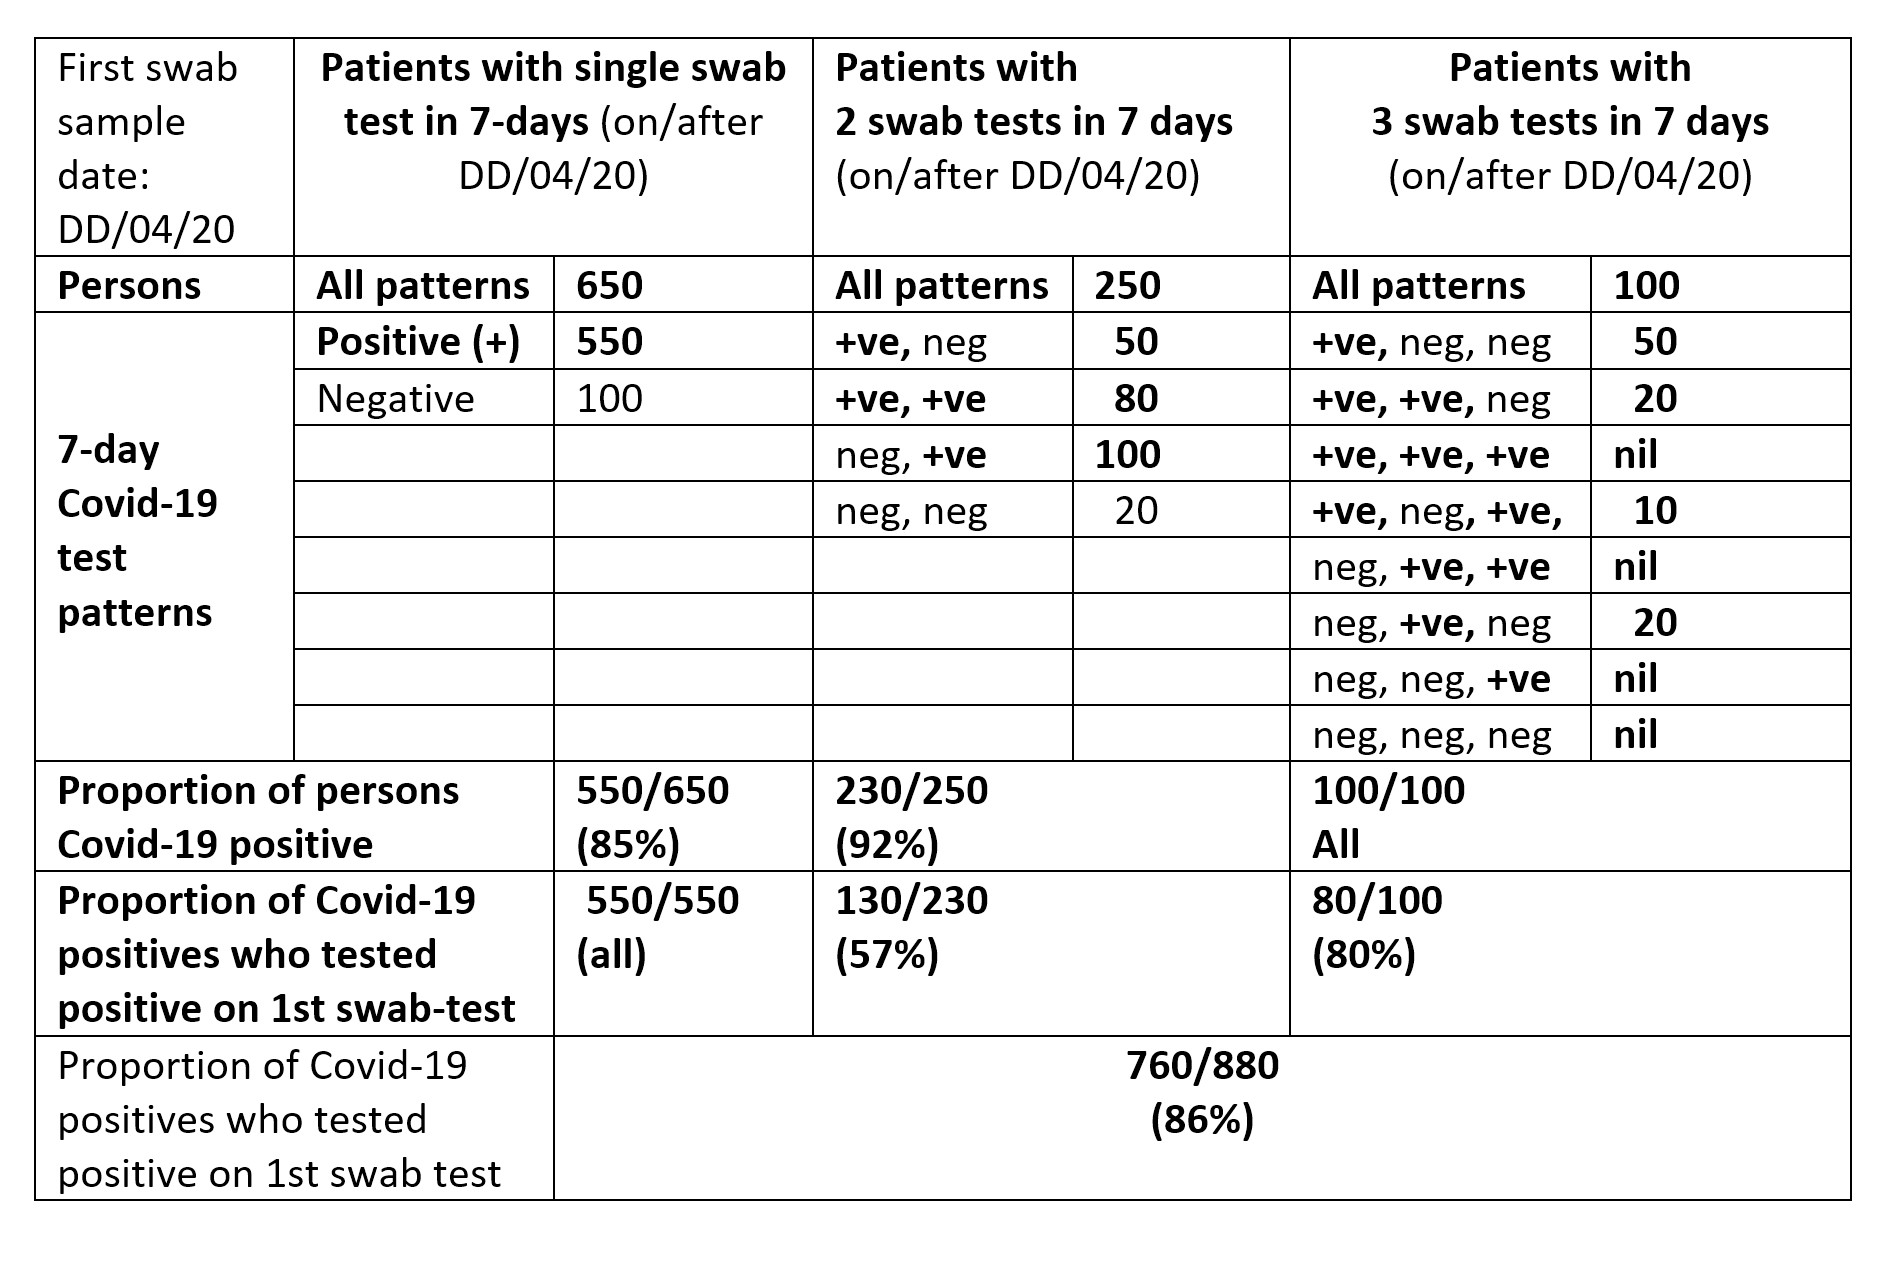
If each person’s test-pattern is linked to information about the patient’s age and gender, then age-group and gender-specific analogues of Table 2 can be summed over first swab sample-dates to offer weekly reporting. By tracking these weekly reports, reliable inferences can be drawn by age-group and gender as the epidemic unfolds.
Conclusion
No inferences can safely be drawn from ill-thought-out daily reporting, as is the case now with the UK’s headline swab test results. Public understanding via the press and even by public health professions is hampered in the process.
Table 1 and Table 2 offer a more insightful account, which includes showing the proportion of hospitalised Covid-19 positive patients who tested positive at their first versus second swab sample. Table 1 also provides daily transparency about the six currently hidden Covid-19 positive rates (labelled a to f). Each table allows common-sense summation across sample days. Summation allows a meaningful weekly account to be given by age group and gender, provided that the laboratory knows the birth-year and gender of each person tested. Such basic demographic information3,4 should be known for all persons tested (or vaccinated) during any epidemic, as in Scotland4,5.
Unless the UK’s data collection and headline public reporting on the performance and results of swab testing improve substantially during lockdown, what confidence can the public have that the UK’s public health system is able rapidly and transparently to detect a resurgence of cases, let alone to isolate and quarantine contacts. The latter is a tall order anyway, needing speed and focus on those whom a person may have encountered recently, including in the two to three days before symptom onset, as around 40% of secondary cases may have been infected when index cases were pre-symptomatic.2
About the author
Sheila M. Bird is formerly programme leader at the MRC Biostatistics Unit, Cambridge University. She is a member of the Significance editorial board and the Royal Statistical Society’s Covid-19 Task Force. She writes here in a personal capacity.
References
- Public Health England. Weekly Coronavirus Disease 2019 (COVID-19) Surveillance Report. Summary of COVID-19 surveillance systems. Year: 2020 Week 17. ^
- He, X., Lau, E. H. Y., Wu, P., Deng, X., Wang, J., Hao, X., Lau, Y. C., Wong, J. Y., Guan, Y., Tan, X., Mo, X., Chen, Y., Liao, B., Chen, W., Hu, F., Zhang, Q., Zhong, M., Wu, Y., Zhao, L., Zhang, F., Cowling, B. J., Li, F., Leung, G. M. (2020) Temporal dynamics in viral shedding and transmissibility of COVID-19. Nature Medicine, 15 April. ^
- Office for National Statistics. Comparison of weekly death occurrences in England and Wales: up to week ending 3 April 2020. ^
- National Records of Scotland. Deaths involving coronavirus (COVID-19) in Scotland, Week 15 (6 to 12 April 2020). ^
- Pavis, S., Morris, A. D (2015) Unleashing the power of administrative health data: the Scottish model. Public Health Research Practice, 25: e2541541. ^


