
The various species of wage floors that have evolved in recent years can be confusing:
- National Minimum Wage (over 21, compulsory): £6.70
- National Living Wage (over 25s, compulsory): £7.20
- Accredited Living Wage (all ages, voluntary) – UK rate: £8.25
- Accredited Living Wage (all ages, voluntary) – London rate: £9.40
We can first distinguish between government-mandated, compulsory minimum wages (including the NLW) and the voluntary version of a Living Wage accredited by the Living Wage Foundation and adopted by over 2,000 employers. These thresholds, moreover, are calculated according to different criteria and therefore represent different objectives, even though they share a general goal of avoiding very low wages.
The NMW has been based on a negotiation between trade unions, employers and economists on the Low Pay Commission to find a threshold compatible with preserving employment levels. The calculation makes no reference to living standards. In contrast, the starting point for calculating the voluntary Living Wage is research on how much workers need for a minimum living standard, averaged across household types. Both the London rate, calculated by the Greater London Authority, and the UK rate, calculated by my team at Loughborough University, are based on research on minimum incomes. Both these calculations include elements to avoid them becoming completely unaffordable for accredited employers. Yet despite its name, the NLW is not calculated with any reference to living standards, although it was clearly influenced by the Living Wage movement’s contention that the existing NMW is too little to live on. In principle, by 2020 the NLW will have reached, and subsequently will be pegged to, 60 per cent of hourly earnings of over-25s. As shown in Figure 1 (which applies to full-time jobs only), this will make the relative level of the adult minimum in the UK one of the most generous in the OECD.
Figure 1. Minimum wage as a percentage of median full-time earnings. Originally published at The Conversation.
The intentions of the new policy are fundamentally different from the cautious approach adopted under the NMW: George Osborne has introduced the NLW with the explicit aim of ending the UK’s low pay culture. In this respect, the gap between the NLW and the UK-wide accredited voluntary Living Wage (currently £1.05 an hour) is likely to be smaller in the future than the NMW/NLW difference (currently 50p an hour). The political commitment to raise the NLW by a further £1.80 or 25 per cent, to £9 an hour, by 2020 makes it likely that it will pull away from the NMW and to some extent converge with the voluntary rate. Indeed, any Living Wage that went much above the NLW projected level in 2020 is likely to have limited impact because it would become difficult for employers to afford.
An important and in many ways problematic difference between the ambitions of a living wage and a minimum wage is that it seeks not just to produce fair pay but also to help people improve living standards for some of the least well off. The problem is that it is a relatively weak instrument for achieving this goal because people with low hourly pay and low household income overlap but are far from identical. Some low paid workers have higher paid partners so are not poor. Many people with low household income relative to their needs have pay above the minimum but have relatively few or no hours of work, and/or relatively large families. Income from other sources such as tax credits may be far more significant than hourly pay rates in improving their income. Moreover a pay rise for someone receiving tax credits will have a muted effect on their incomes, since nearly three quarters will be recouped by the Treasury in reduced entitlements and higher taxation, if they earn enough to pay income tax. This could in principle mean that a higher wage floor makes it more affordable for the Treasury to retain generous transfers to people with low family incomes, but the current Treasury strategy is to reduce this protection and hope that wages provide a substitute.
Figure 2 shows that gains from the NLW will be spread across the household income distribution. The biggest winners, in percentage terms, will be those in the third and fourth income deciles, who tend to be among the poorest working households. The main reason the bottom two deciles make limited gains is that they are less likely to have anyone in work. Thus while a higher wage floor has relatively modest overall distributional effects in itself, it does offer the opportunity for people on the lowest incomes to improve their living standards through work, rather than getting a job only to find that they remain poor.
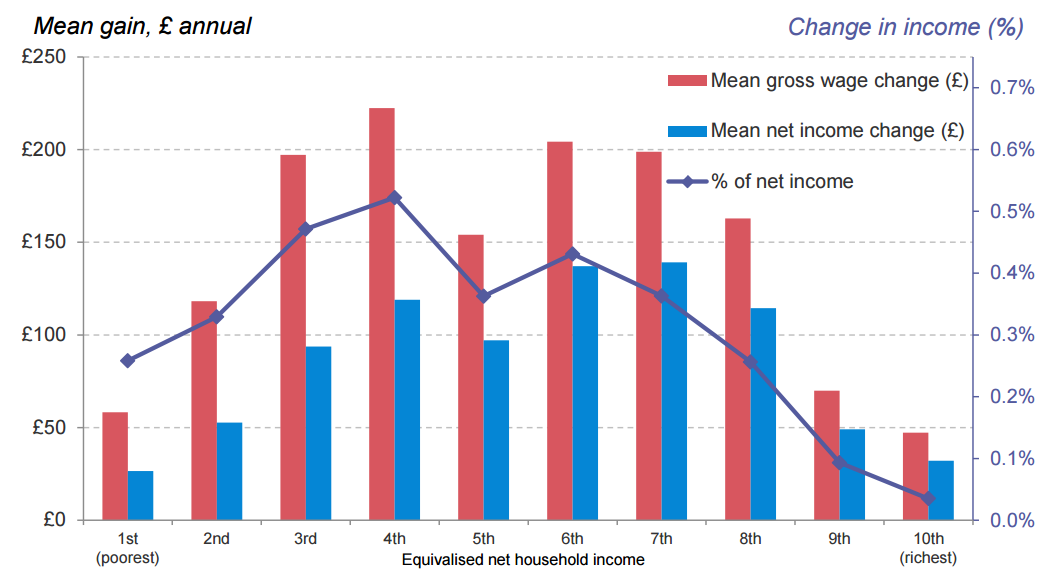
Figure 2. Gains from the National Living Wage by household income decile, 2020. Source: Resolution Foundation analysis using the Family Resources Survey, the Labour Force Survey and the IPPR tax-benefit model. Republished from ‘Higher ground: Who gains from the National Living Wage?’.
So changing wages must be considered alongside employment patterns and opportunities. But Figure 3 shows that even more importantly, they cannot be divorced from changes in income transfers. In the summer 2015 budget, George Osborne directly linked the NLW to cuts in in-work benefits, and this graph shows that the long-term net effect for low income families would be to become worse off. These results remain valid despite the government’s abandoning in the autumn of tax credit cuts announced in the budget: the calculations are based on Universal Credit entitlements in 2020, for which the cuts remain unmodified.
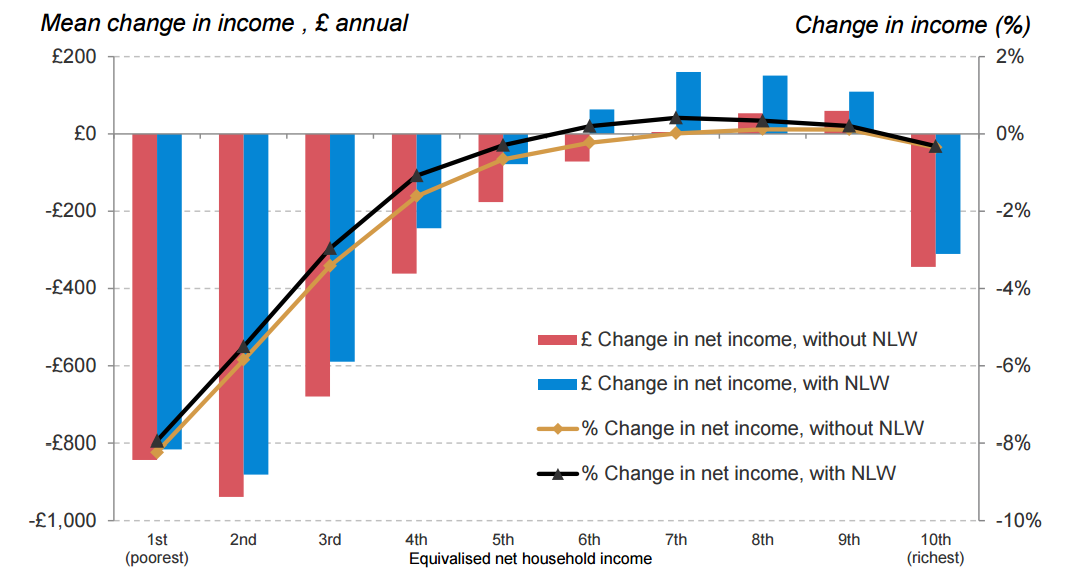
Figure 3. Impact of the Summer 2015 Budget with and without the National Living Wage, 2020. Source: Resolution Foundation analysis using the Family Resources Survey, the Labour Force Survey and the IPPR tax-benefit model. Republished from ‘Higher ground: Who gains from the National Living Wage?’.
The above graphs suggest that higher wage floors can potentially contribute to poverty reduction, but will make little headway on their own. This confirms evidence showing that the Minimum Wage only affects a small minority of those in poverty.1, 2 The willingness of government to set substantially higher wage floors potentially releases money previously used to top up low pay, to help protect families who still end up on inadequate incomes. Unfortunately, there is no indication that the present government will use it for this purpose, given its desire to cut the overall “welfare” bill. But I will be setting out some principles on how to achieve a fair balance between pay and income transfers at my inaugural lecture at Loughborough University on 27 April, which is open to all.
-
Professor Donald Hirsch is director of the Centre for Research in Social Policy, Loughborough University
References
- Bennett, Fran (2014) The ‘living wage’, low pay and in work poverty: Rethinking the relationships. Critical Social Policy, Vol. 34, No. 1, S. 46-65.
- Cooke G and Lawton K (2008) Working Out of Poverty: A Study of the Low Paid and the ‘Working Poor’. London: Institute for Public Policy


