
Kevin Lin, winner of the 2017 Statistical Excellence Award for Early-Career Writing, explores political engagement via the social media site Reddit in the years leading up to the election of President Donald Trump.
Hardly a day goes by without reporters making generalisations about the behaviour of “millennials” in the United States – defined by the Pew Research Center as “the first generation to come of age in the new millennium”. As a millennial myself, I typically roll my eyes when I read how we are supposedly “too materialistic” or that we suffer from “short attention spans”. But then a new article piqued my curiosity. The piece, published in May last year by Rolling Stone, argued that young people were having a profound effect on the 2016 presidential election “from the outside, as activists; from the inside, as essential parts of the campaign machinery; and as voters”.
Millennials are often accused of being disengaged from politics, but here was an article that hinted at a growing interest in the subject, mirroring my own experience. I never cared much for politics, but I figured this was a personal lack of interest, not a generational trait. I started paying attention only as the 2016 election began dominating the news, so it seems likely that others my age would have done the same. But how might we determine whether this is the case, that millennials are becoming more interested in politics?
Voting is one way to engage in the political process, but there are limited opportunities to vote, so this form of engagement can only be measured at wide intervals. Surveys provide another way to measure political engagement, but may be conducted infrequently. In the online space, however, “engagement” is being tracked constantly: campaign groups, lobbyists, charities, brands and companies monitor user engagement with social media by counting the number of likes, retweets, shares, and other similar actions. Social media, therefore, offers a proxy we can work with.
“The front page of the internet”
Reddit (a play on the phrase “read it”) is a popular online collection of message-boards used by roughly 4% of Americans, two-thirds of whom are millennials. These message-boards are called “subreddits” and specialise in various topics, such as politics. Subreddits, kept orderly by moderators, allow users to “upvote” posts, as shown in Figure 1. Users can upvote a post to show that they feel the post is relevant to the particular subreddit and would like to increase the post’s visibility. Typically, posts with more upvotes would be listed first among posts created around the same time. (As a side note, users can upvote specific comments made on posts, but we will only investigate the upvotes for the posts themselves.) We will be using the number of upvotes across the top posts of each week to infer the traffic on /r/politics (the politics subreddit, pronounced “slash-r-slash-politics”). This in turn may provide some insight into the political engagement of Reddit users specifically and millennials more generally.
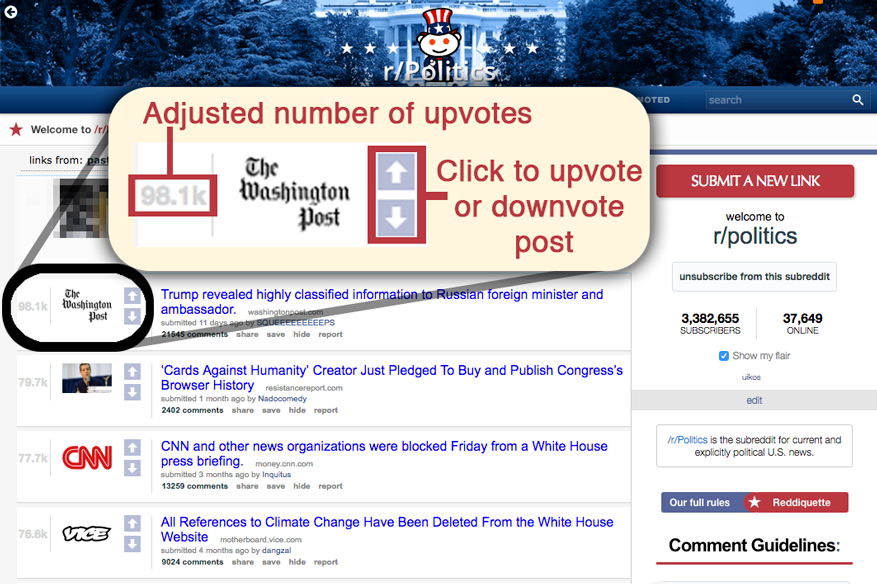
FIGURE 1 Screenshot of /r/politics, showing the top posts from May 2016 to May 2017. To the left of each post is the adjusted number of upvotes, and to the right there are arrows to either upvote or downvote a post.
However, analysing the upvote activity on /r/politics to infer the political engagement of millennials requires a number of assumptions. We consider the two main assumptions:
- The audience on /r/politics is an accurate reflection of the American millennial population in terms of demographics and political views.
- Users of /r/politics upvote posts to show their political engagement.
The first assumption can only be partially supported by the demographic research of Reddit users performed by Pew Research, which finds that the dominant group of Reddit users are college students between 18 and 29. Also, the 3.3 million users on /r/politics primarily lean liberal, which agrees with other survey-based assessments of the millennial generation. However, this is far from being a representative sample, so we must be cautious with any generalisations.
Using upvote counts is a more delicate issue for two reasons. First, the number of upvotes is conflated due to the option to “downvote” a post. The guidelines on /r/politics suggest that users should downvote a post only if it “does not contribute to the thread it is posted in or if it is off-topic in /r/politics”. Reddit reports the number of upvotes after accounting for the downvotes, and fuzzes this adjusted value to stop people attempting to game the system (see here for more on “vote fuzzing”). Second, many subreddits have experienced more upvotes over time due to the growing popularity of Reddit. We therefore benchmark the traffic on /r/politics to other subreddits at the conclusion of this article. All that said, since each user can only upvote or downvote a post once, the reported number of upvotes is a reasonable reflection of how many people are engaged with a particular post.
To begin my analysis, I scraped data from /r/politics. With a bit of help from the Reddit API, the PRAW Python package, and a day’s worth of work, I gathered the top 50 posts for each week over the last nine years (the furthest back I could go) and recorded the number of upvotes for each post. After averaging the number of upvotes across each week’s posts, I compiled a time series illustrated in Figure 2 to approximate the activity on /r/politics over that time, which we can refer to as “traffic”. These data contain posts starting from the week of 18 May 2008 and ending on the week of 3 April 2017, for a total of 464 weeks.

FIGURE 2 Time series of traffic on /r/politics from the end of George W. Bush’s presidency to the start of Donald Trump’s presidency. The red points are weeks under a Republican president; blue dots are weeks under a Democratic president. Vertical lines mark the start of a new presidential term.
It is immediately apparent that activity on /r/politics spiked around the time Donald Trump’s administration moved into the White House, and we could probably spot several other locations during the Obama presidency where traffic appears to increase sharply. However, it is hard to identify the exact location of these spikes and the events to which they may relate. Perhaps an algorithm can help us make sense of what we are seeing.
News heard around the world
Although traffic on /r/politics changes from week to week, we want to partition our 464 weeks into periods of time where the average traffic is mostly constant. Furthermore, we interpret the news events at the beginning and end of each of these periods as news that may have stimulated millennials politically. This type of analysis is called changepoint detection, and the identified changepoints represent specific times after which the data suddenly behaved differently.
To identify these changepoints, we use an algorithm called binary segmentation. This iterative algorithm finds a specific week to be a changepoint such that the average (mean) number of upvotes prior to that week differs from the average upvotes after that week. Then it recursively applies the same procedure on the upvotes data to the left and right of the selected week until a stopping criterion is met. This is illustrated in Figure 3. Binary segmentation allows us to estimate the changepoints – the specific weeks where the traffic on /r/politics changes – in a data-driven way. Afterwards, we compute the average traffic over the weeks where we suspect that traffic remains mostly constant.

FIGURE 3 Illustration of how binary segmentation works on only the first two iterations. The dotted, vertical black lines denote the detected changepoints (cp) in a particular iteration, while the thick, horizontal black lines represent the average number of upvotes of each segment of observations.
We display our final estimates of the average traffic on /r/politics in Figure 4 as well as Table 1. Together they show the six specific weeks where binary segmentation detected a change in the average amount of traffic to /r/politics, as well as the major political events of those weeks. For example, the final two identified changepoints correspond with the 2016 election and the beginning of Trump’s presidency. But can we determine whether these changes in traffic occurred purely by chance? Enter a statistical model.
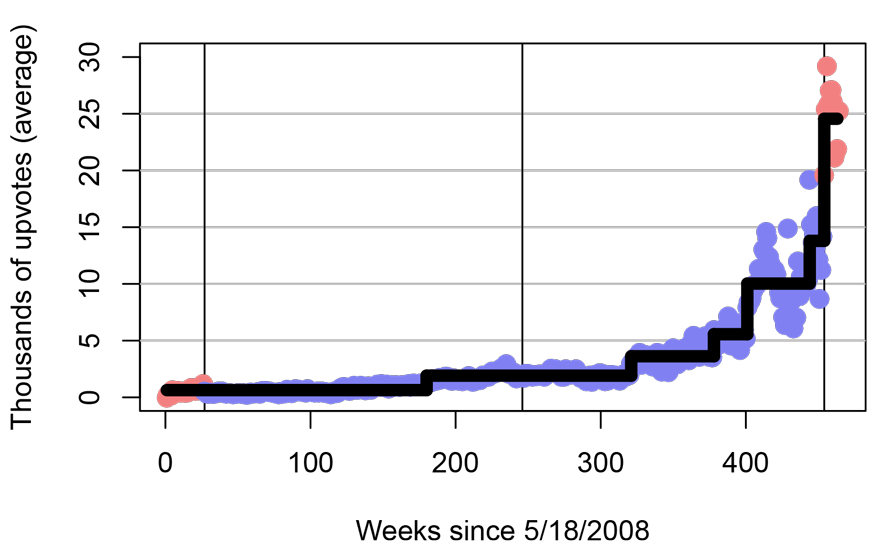
FIGURE 4 Time series of traffic on /r/politics. The black lines show step changes in the estimate of average traffic over seven different periods, based on six changepoints identified by a binary segmentation algorithm.
TABLE 1 Weeks of detected change in traffic on /r/politics.
| Week no. | Week of | Change in upvotes | Major news events |
| 179 | 16 October 2011 | +1274 | Occupy Wall Street. |
| 320 | 29 June 2014 | +1708 | Lawsuit from Hobby Lobby results in Supreme Court allowing corporations to exempt themselves from regulations on grounds of religious objections. |
| 377 | 2 August 2015 | +1944 | Senate votes on funding for Planned Parenthood. |
| 400 | 10 January 2016 | +4465 | Bernie Sanders is about to close the polling gap between himself and Hillary Clinton in the Democratic Primary. |
| 443 | 7 November 2016 | +3768 | Week of 2016 election. |
| 453 | 15 January 2017 | +10 762 | Donald Trump’s inauguration. |
What’s so significant about “significance”?
Imagine we had a method to mathematically recreate the traffic on /r/politics over the last nine years. This is a statistical model, a procedure that specifies how the data was possibly generated. We design our statistical model with the following properties:
- Each of the 464 observations, shown in Figure 2, is the sum of a specified number of upvotes and a noise term.
- Additionally, the specified number of upvotes across the 464 weeks remains the same from week to week, with the exception of a few weeks.
These two properties formalise a model implicitly used by binary segmentation, introduced in the previous section. The first property allows us to set a specified number of upvotes, while the noise term enables realistic, minor fluctuations in the observed number of upvotes from week to week. The second property keeps the specified traffic constant from week to week, with the exception of specific changepoints. For example, this model could capture the notion that the traffic on /r/politics was stagnant during most of Obama’s administration, but interest in politics grew immediately after the 2016 Republican and Democratic National Conventions.
Since we can freely manipulate this statistical model, we can set the specified number of upvotes across the 464 weeks, add random noise to produce data similar to that shown in Figure 2, rerun our binary segmentation algorithm, and see what new changepoints we estimate.
Let us consider the following hypothetical: we set the specified traffic on /r/politics to be constant from 18 May 2008 to 29 June 2014. Statisticians formally call this hypothetical scenario the null hypothesis, where “null” alludes to “no change in the specified traffic in a certain range of weeks”. It is quite possible that even though our specified traffic does not change, on average, from 18 May 2008 to 29 June 2014, the random noise that we add may influence the binary segmentation algorithm to estimate a changepoint on 16 October 2011 purely by chance. From Table 1 we see that our algorithm previously detected an increase in the number of upvotes that week of 1274. But under our null hypothesis, we are interested in seeing how likely it is that our algorithm would estimate an increase of 1274 upvotes on the week of 16 October 2011 and mark it as a changepoint even when there is no change in the average amount of traffic over the specified period.
We can actually compute the probability of estimating any amount of increase in upvotes that week based on the null hypothesis. Once we have this distribution of hypothetical increases, we can report the area of the distribution to the right of 1274. This represents the probability that, under the null hypothesis, we would observe a change of 1274 upvotes or more on 16 October 2011. In this case, the probability is 47%. This means that, according to our statistical model, it is likely that our algorithm would estimate an increase of 1274 upvotes on 16 October 2011 by chance, even though we specified the traffic to be constant, on average, from 18 May 2008 to 29 June 2014. We illustrate this concept in Figure 5.
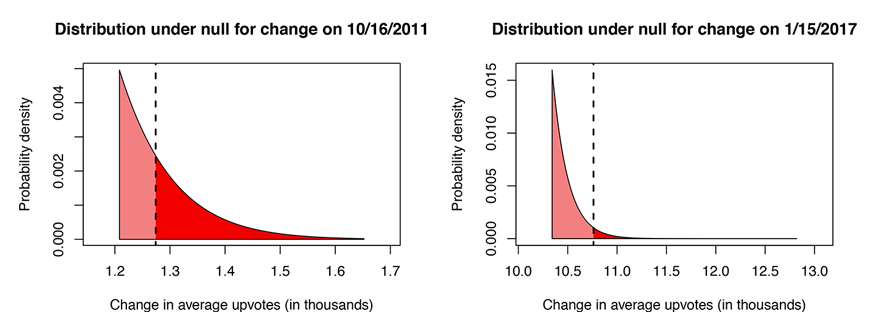
FIGURE 5 Distribution of changes in average traffic on /r/politics under the null hypothesis at specific weeks: 16 October 2011 (left) and 15 January 2017 (right). The dotted, vertical line denotes the estimated change in upvotes (+1274 and +10 762, respectively) while the distribution curve denotes the probability of the hypothetical changes that could have been observed under the null hypothesis. The area to the right of the estimated change line, shaded red, represents the chance of the estimated change occurring under the null hypothesis (47% and 0.1%, respectively).
If we repeat this exercise to investigate the increase of 10 762 upvotes on the week of 15 January 2017, coinciding with Trump’s inauguration, we see that the probability of this increase occurring under the null hypothesis would be near 0.1%. This means our algorithm is extremely unlikely to detect such a large change in traffic on 15 January 2017 when we specify the traffic to be constant from 7 November 2016 to 3 April 2017. Statisticians formally call this a statistically significant finding, meaning we observed a phenomenon that is unlikely to occur (with a probability of less than 5%) if we specified no phenomenon to occur in our statistical model. Table 2 reports our findings.
TABLE 2 Analysis of the statistical significance of previously detected changepoints in /r/politics traffic.
| Week of | Changes in upvotes | Probability of change occurring due to chance under null hypothesis | Conclusion |
| 16 October 2011 | +1274 | 47.0% | Not significant |
| 29 June 2014 | +1708 | 4.5% | Significant* |
| 2 August 2015 | +1944 | 75.4% | Not significant |
| 10 January 2016 | +4465 | 0.9% | Significant |
| 7 November 2016 | +3768 | 2.1% | Significant |
| 15 January 2017 | +10 762 | 0.1% | Significant |
*While the test itself gives a p-value that is significant, this is subject to change when accounting for multiple testing. Also, we show later (see Figure 6) that this particular change is not of practical significance.
Here we come
Analysis shows that the last three major surges in the traffic on /r/politics within the last two years are all statistically significant. My interpretation of this is that Reddit users specifically, and perhaps millennials more generally, are becoming more politically engaged, most likely due to the chaotic events of the 2016 election. Of course, there is a list of possible interpretations that support these statistical findings, and we would want to carry out further investigations to narrow down this list. For instance, it is possible that overall activity on Reddit increased just as much as that on /r/politics, so the increase in traffic has little to do with political engagement.
At the time of this article’s writing, /r/politics is the 55th largest subreddit, with over 3.3 million users. I use the same procedure to scrape other popular subreddits: /r/news (with 14.6 million users), /r/funny (concerning funny images, with 17.2 million users) and /r/bestof (focusing on insightful Reddit comments, with 4.7 million users). Figure 6 shows that, unlike /r/politics, these other subreddits did not see a nearly fivefold increase in traffic over the last three years (from week 320 onwards), suggesting that Reddit users are engaging with /r/politics faster than other subreddits.
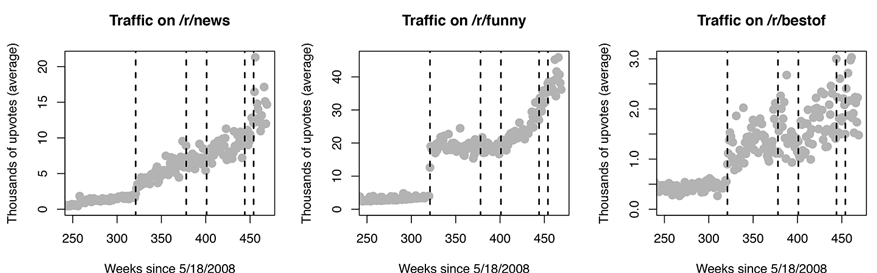
FIGURE 6 Traffic on other subreddits, based on the same data-collection procedure used for /r/politics. The dotted, vertical lines denote the specific weeks of detected changes on /r/politics, superimposed on these plots for reference. We see a global increase in traffic across these three subreddits at the 320th week, the week of 29 June 2014, suggesting that what we previously deemed statistically significant in Table 2 is contextually irrelevant since the workings of Reddit probably changed in some way that week.
Other investigations might assess whether the opinions of /r/politics users are similar to those of millennials who are not active users of the site or subreddit. It would also be interesting to see whether there is a viral effect at work within Reddit, as it is conceivable that the popularity of posts is selfinducing: users may upvote a post simply because other users have upvoted a post, not because of any deeper engagement with the subject matter.
For now, though, I believe that my analysis of Reddit data supports the idea that the 2016 election and the start of the Trump presidency served to inspire millennials like me to become more politically engaged. The challenge, however, is to convert social media clicks into votes. Voting turnout for my age bracket barely passed 40% in the 2016 election, and historically it has been abysmal during mid-term elections, hovering around 20%. The /r/politics subreddit might have seen statistically significant increases in upvotes during the most recent election period – but if we, the millennials, wish to become a politically significant force, we need to be heading to the voting booth in much greater numbers.
Note
The hypothesis test used in this article was developed in collaboration with Sangwon Hyun, Max G’Sell, and Ryan Tibshirani, all part of Carnegie Mellon University’s Department of Statistics, for their research in post-selection inference.
About the author
Kevin Lin (@linnylin92) is a PhD candidate in statistics at Carnegie Mellon University.
About the competition
Our annual writing competition is organised in partnership with the Young Statisticians Section (YSS) of the Royal Statistical Society (RSS). The award exists to celebrate those early-career statisticians who can demonstrate the skills necessary for effective communication and who recognise just how important it is for statisticians to explain their work to an audience of non-experts. The competition has been running for six years, but 2017 marks the first time the competition has been part of the RSS Statistical Excellence Awards programme. This year’s competition saw submissions from across the globe – from several African nations, Australia, Belgium, Brunei, Costa Rica, India, Mexico, New Zealand, the United Kingdom and the United States.
Judges found Kevin Lin’s winning article to be both timely and topical. It makes interesting use of Reddit data while taking the time to acknowledge the assumptions that have been made and the limitations of the information available. The story is clearly told and written in a journalistic style that makes it an ideal fit for Significance and a worthy winner of this year’s contest.
Runner-up articles by Charlotte Moragh Jones-Todd and Levon Demirdjian will be published soon.
Thank you to this year’s judges: (for the YSS) Stephen Blaxland, Markus Elze, Katie Fisher, Lisa McCrink and Janette McQuillan; (for Significance) Mario Cortina Borja, Allan Reese and Kelly Zou.
Details of next year’s competition will be announced in February 2018.
Brian Tarran


