
In this article we describe some of the data available from the official Facebook pages of these two campaign groups. We aim (i) to illustrate the use of freely available R5 tools for extracting information from these pages and for summarizing the resulting text data, (ii) to display graphically the contents of posts on these pages using word clouds, and (iii) to look for trends in the volume and content of posts. We are well aware of the analytical limitations associated with using this type of publically available data, such as self-selection biases, but we believe that they provide basic summaries that may serve as snapshots of the evolution of the campaigns.
There has recently been a large increase in the techniques available to process structured data from social media,6,7,8,9 often developed in the context of Twitter.10 We can download information from Facebook using Barbera and Piccirilli’s Rfacebook11 R package. An access token is required from Facebook. The Rfacebook function getPage allows us to download information about posts to a Facebook page; the user can specify the number of posts required and the date range. We have found that it is better to download posts on a day-to-day basis and then to combine results. A range of information is available for each post including its message, when it was created and the number of likes, comments and shares received.
From this information, we can work out the number of posts in each month and the monthly average number of likes, comments and shares. This is illustrated for the Britain Stronger in Europe and the Vote Leave pages in Figure 1 using graphs produced using ggplot2.12 The months considered are January to June 2016 (June was incomplete at the time of writing, 16 June 2016) and the quantities presented have been standardized to reflect the different number of days in each month. These plots indicate increasing activity as the referendum date approaches. Also, the average number of likes and shares for Vote Leave is considerably higher than for Britain Stronger in Europe.
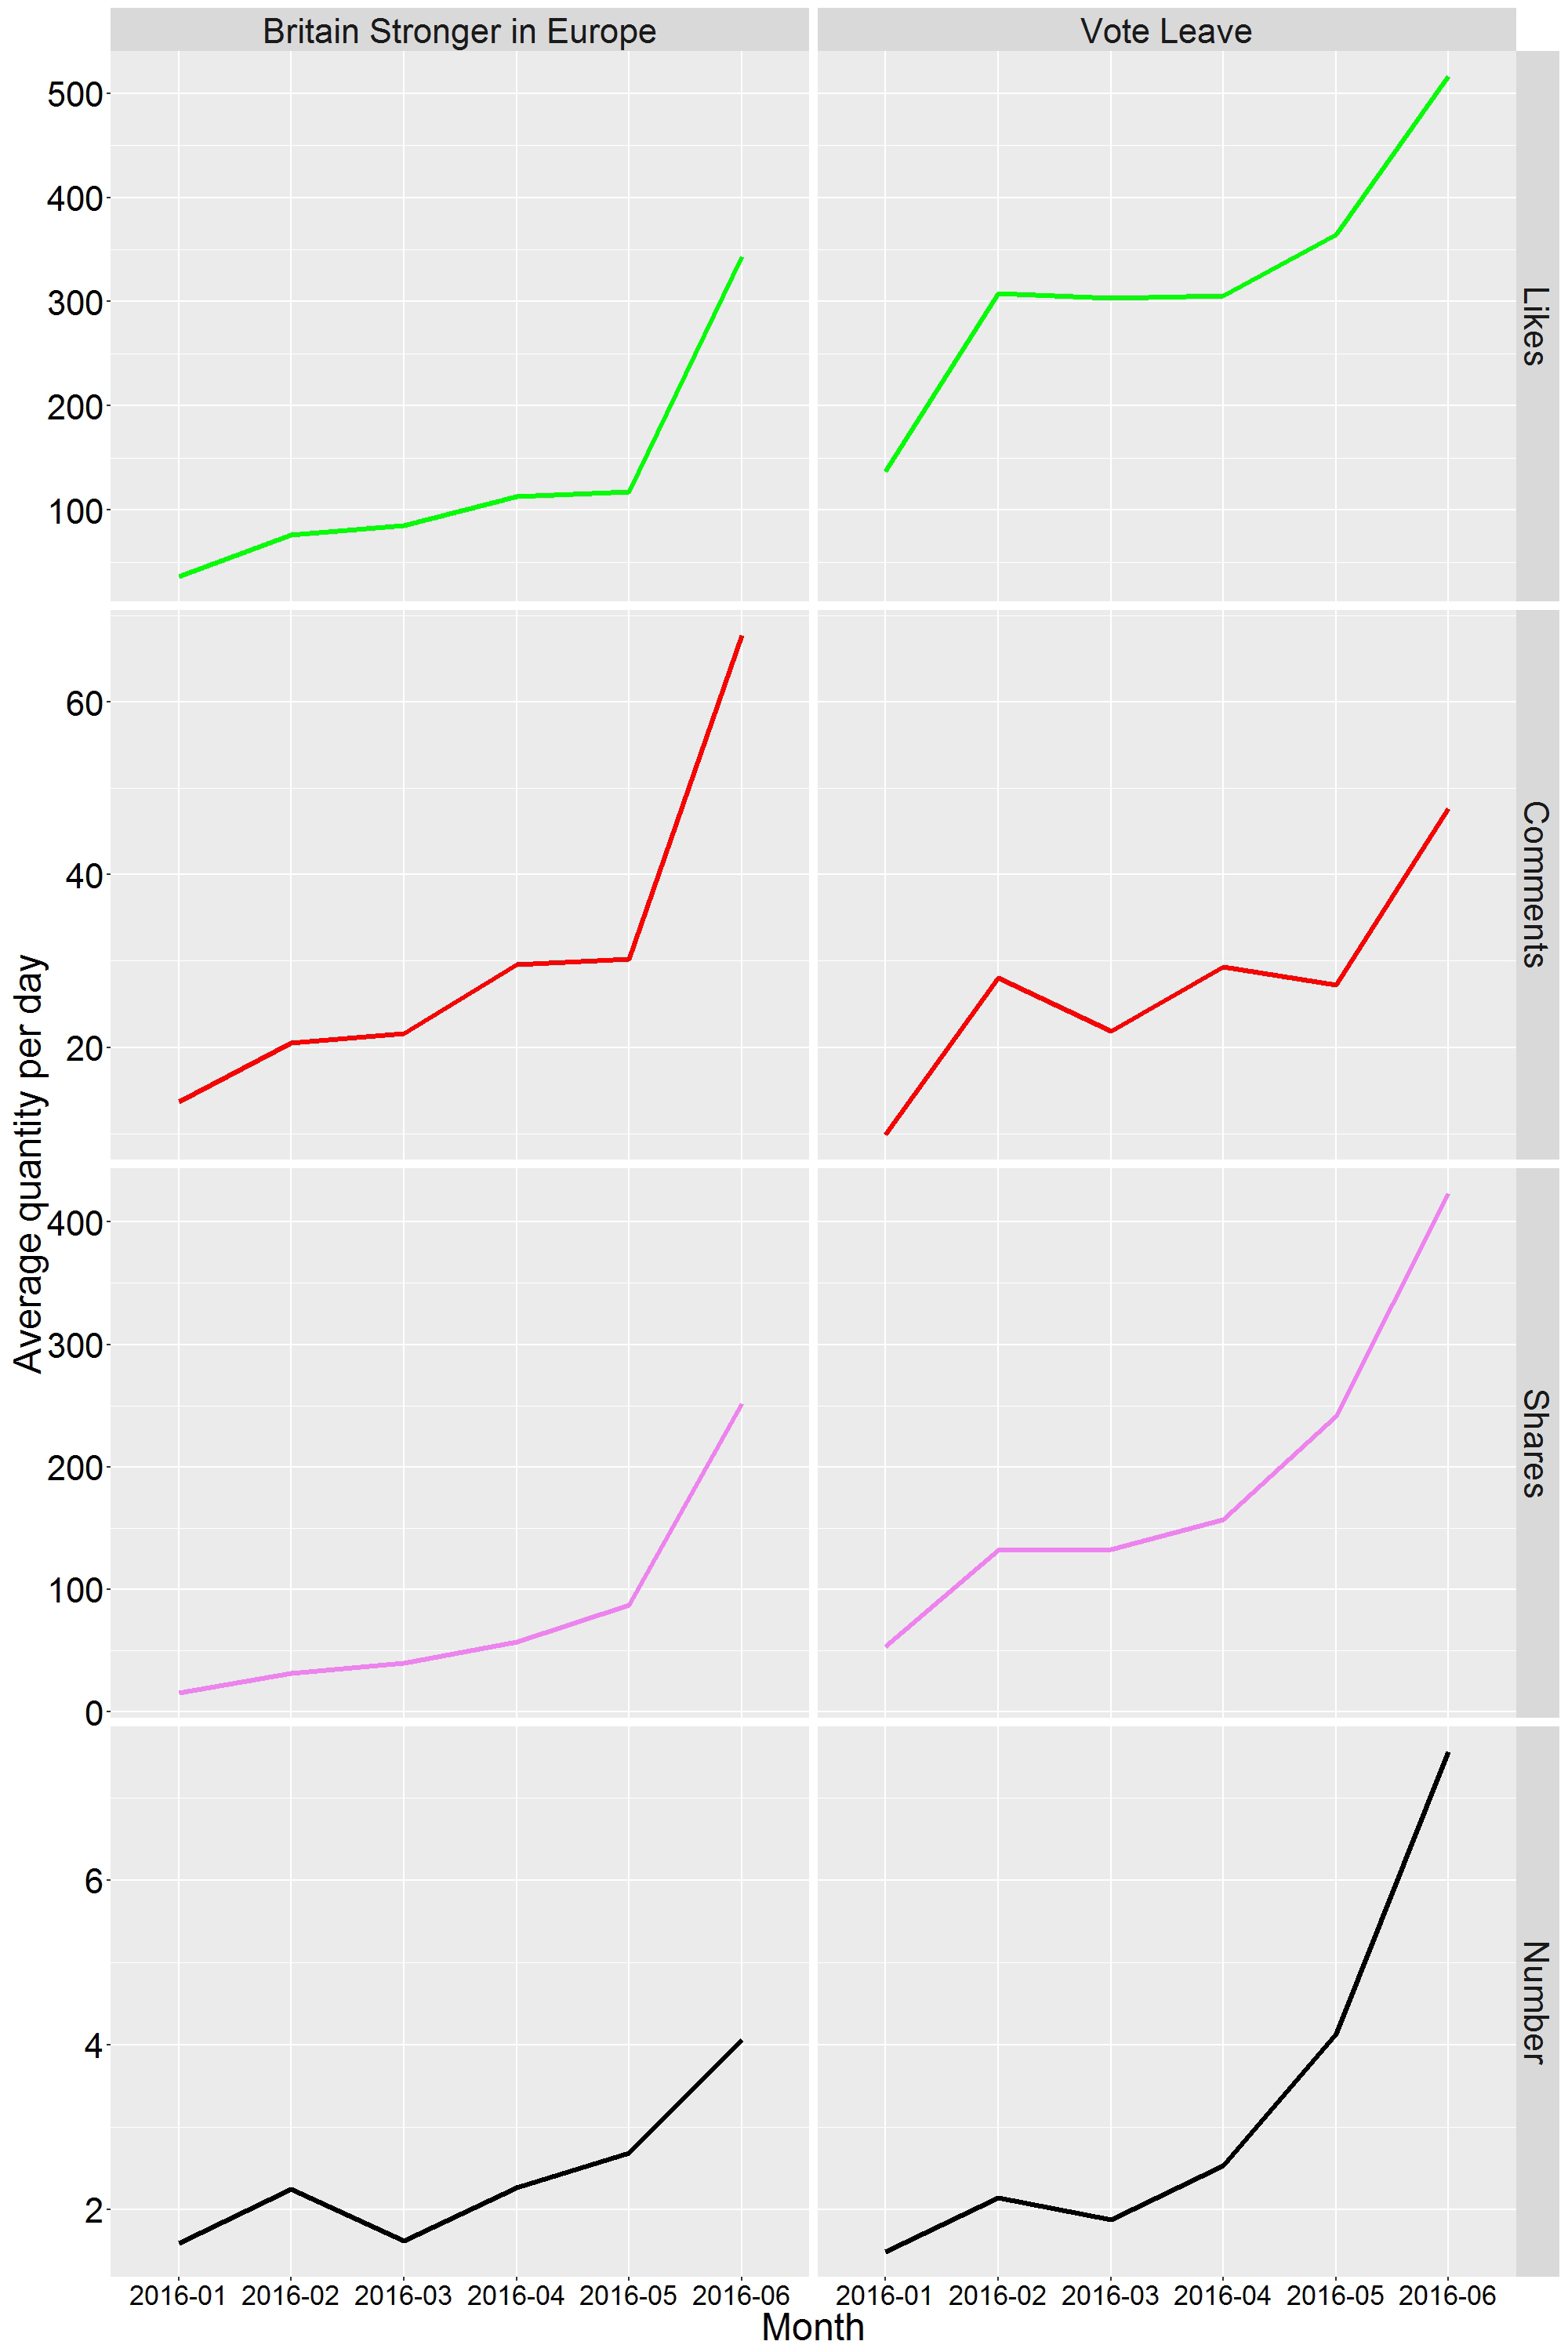
Figure 1. The average number of likes, comments and shares per day for posts in each month and the daily number of posts for the Britain Stronger in Europe and the Vote Leave Facebook pages
We can also analyse the text data contained in the message of each post. Some pre-processing is required to remove null posts and emoticons for example, and this was performed using the stringr13 package. Word counts can then be obtained using Feinerer and Hornik’s text mining package tm.14 This package provides functions that allow us to work with a collection of Facebook posts called a 'corpus' and to produce a 'document term matrix' that records how many times each word appears in each post. Word frequencies can easily be produced from this matrix and displayed as a word cloud using Fellow’s wordcloud15 package. Example word clouds for the two campaign pages are shown in Figure 2. The more often a word is used, the larger and more centrally it is displayed. These word clouds highlight the main issues being posted on these pages. If one had to provide a few phrases from each campaign based on each word cloud, one could write “Sharing is better for the economy and important for families. Leaving puts jobs at risk”, and “People can take back control of the borders. There would be more money for the NHS”.
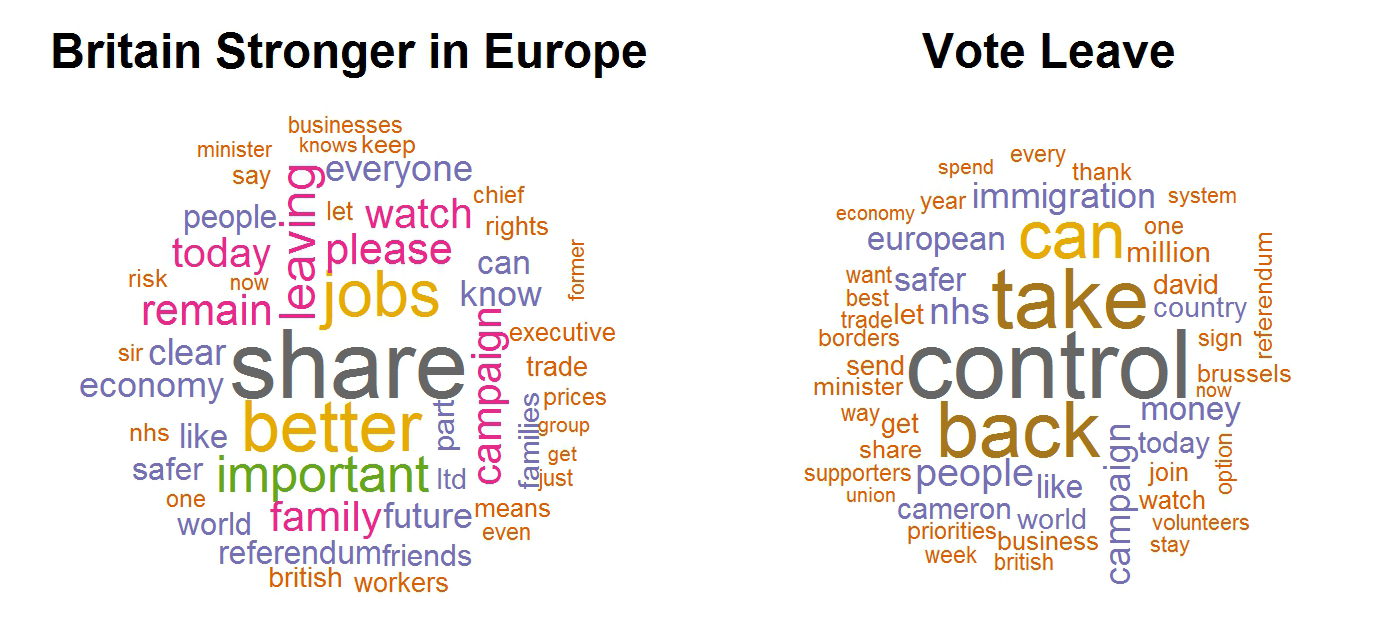
Figure 2. Word clouds summarising the text data posted on the Britain Stronger in Europe and the Vote Leave Facebook pages since the beginning of 2016
It is also possible to perform a simple sentiment analysis on the text data. Sentiment analysis aims to determine whether the opinions expressed on posts or pages are positive, negative or neutral. Although sentiment analysis is a very broad and complicated topic, we adopt a simple approach of matching posts to dictionaries of positive and negative words supplied by Liu, Hu and Cheung.16 Liu, Hu and Cheung supply 2,006 positive words and 4,783 negative words in their dictionaries. A phrase such as “This is good” has one positive match and so scores 1, while the phrases “This is not good” (a negated positive match) and “This is bad” (a negative match) score 0 and –1. Figure 3 presents the sentiment scores for posts on our two example pages, together with summary statistics in the legends. The mean sentiment score is higher for Britain Stronger in Europe, even though the value for Vote Leave is inflated by a few long or repetitive posts with very high sentiment scores.
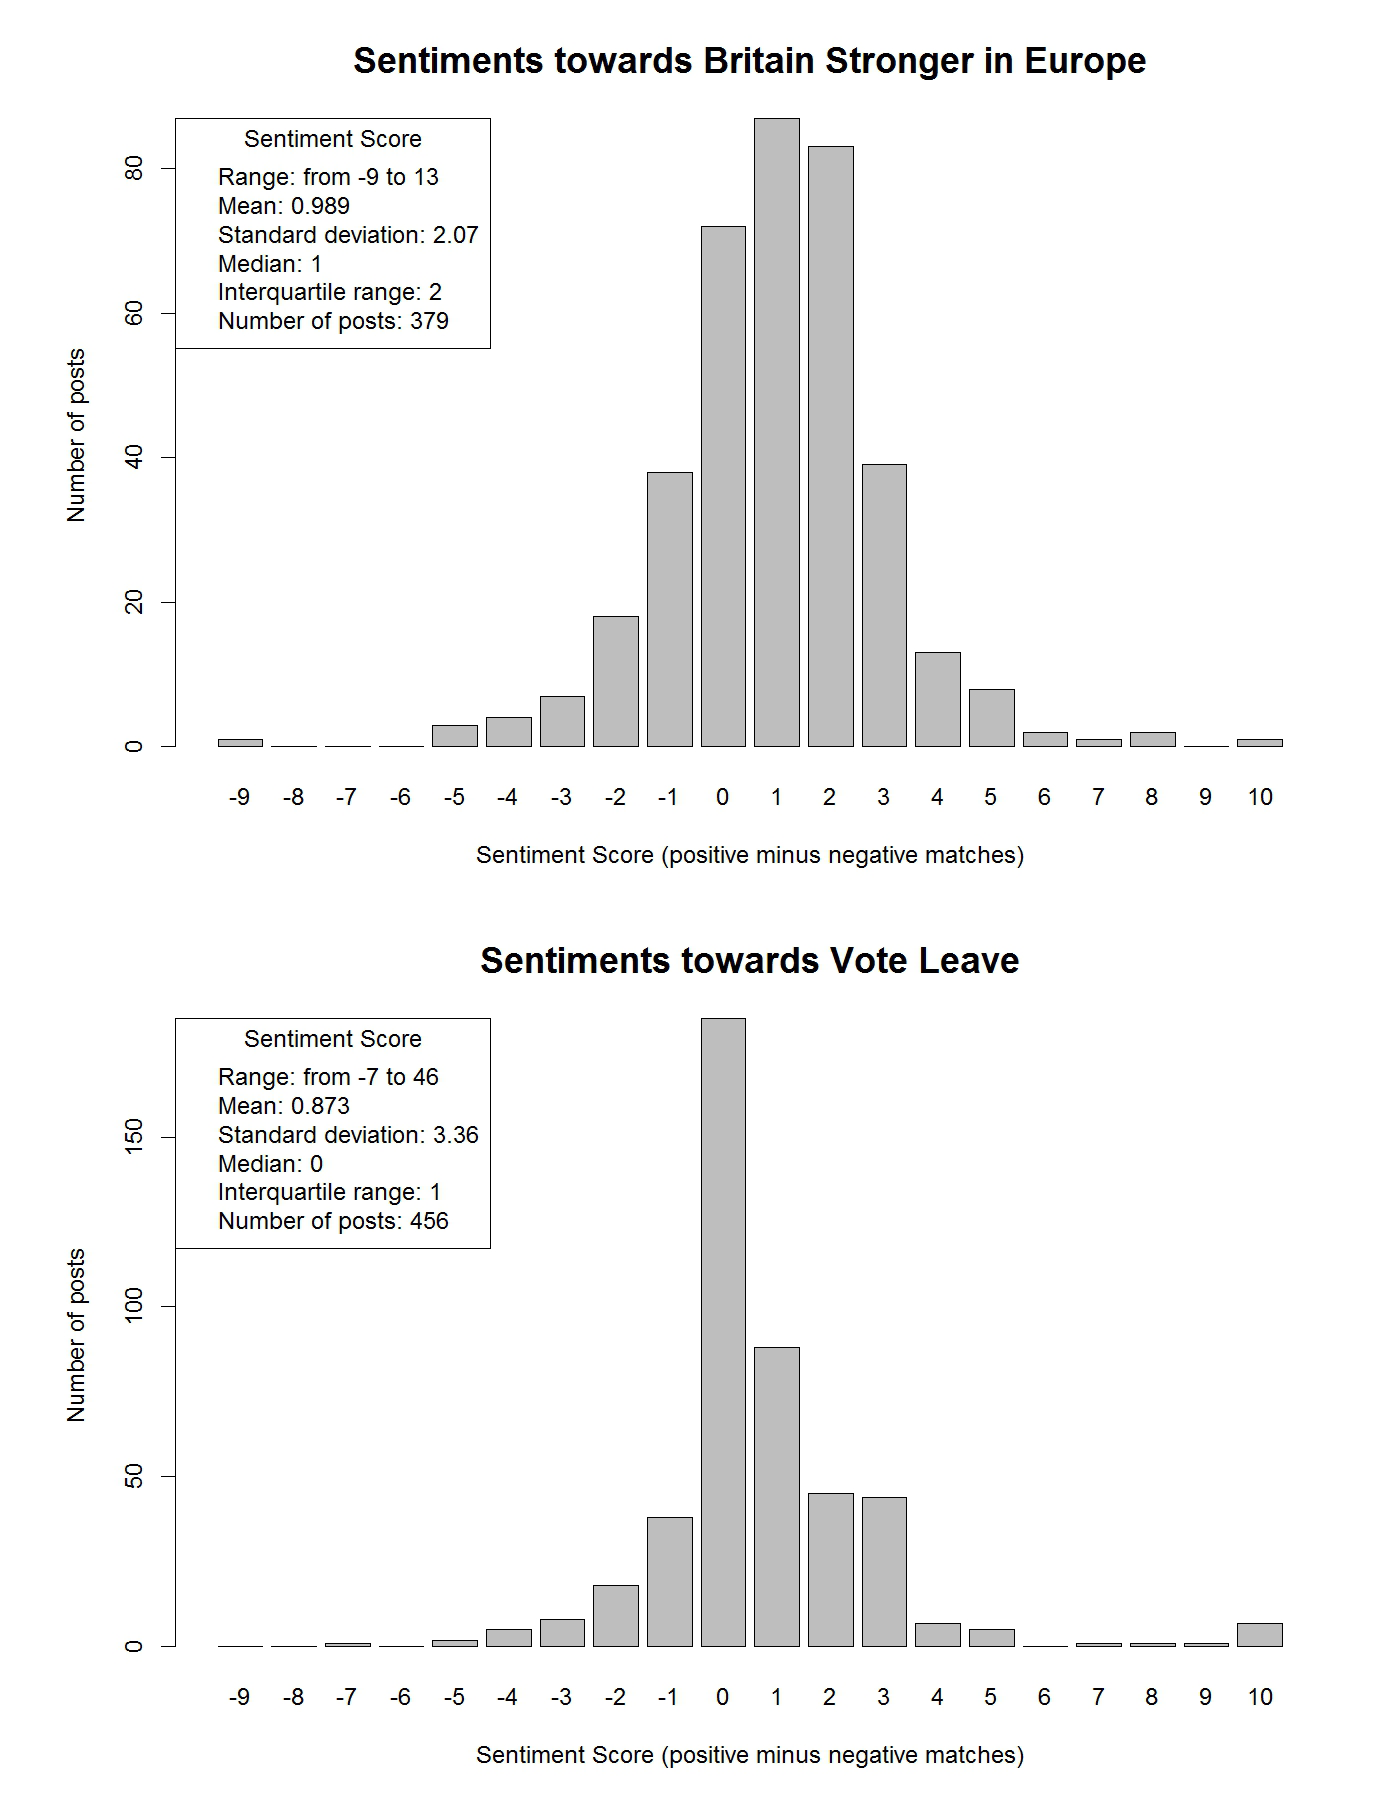
Figure 3. Simple sentiment analyses for the text data posted on the Britain Stronger in Europe and the Vote Leave Facebook pages since the beginning of 2016. The mean sentiment score is also given. A few posts with very high sentiment scores (due to length or repetition) have been truncated to a score of 10 in the plot. Summary statistics are provided in the legends
As the date and time of each post are also available, it is possible to investigate how the sentiment score has changed over time. This is illustrated in Figure 4, where average sentiment scores for each month are shown, together with plus and minus two standard errors. Posts on the Britain Stronger in Europe page seem to be relatively constant in their positivity, with a slight decline in June, while those on Vote Leave show a marked decline.
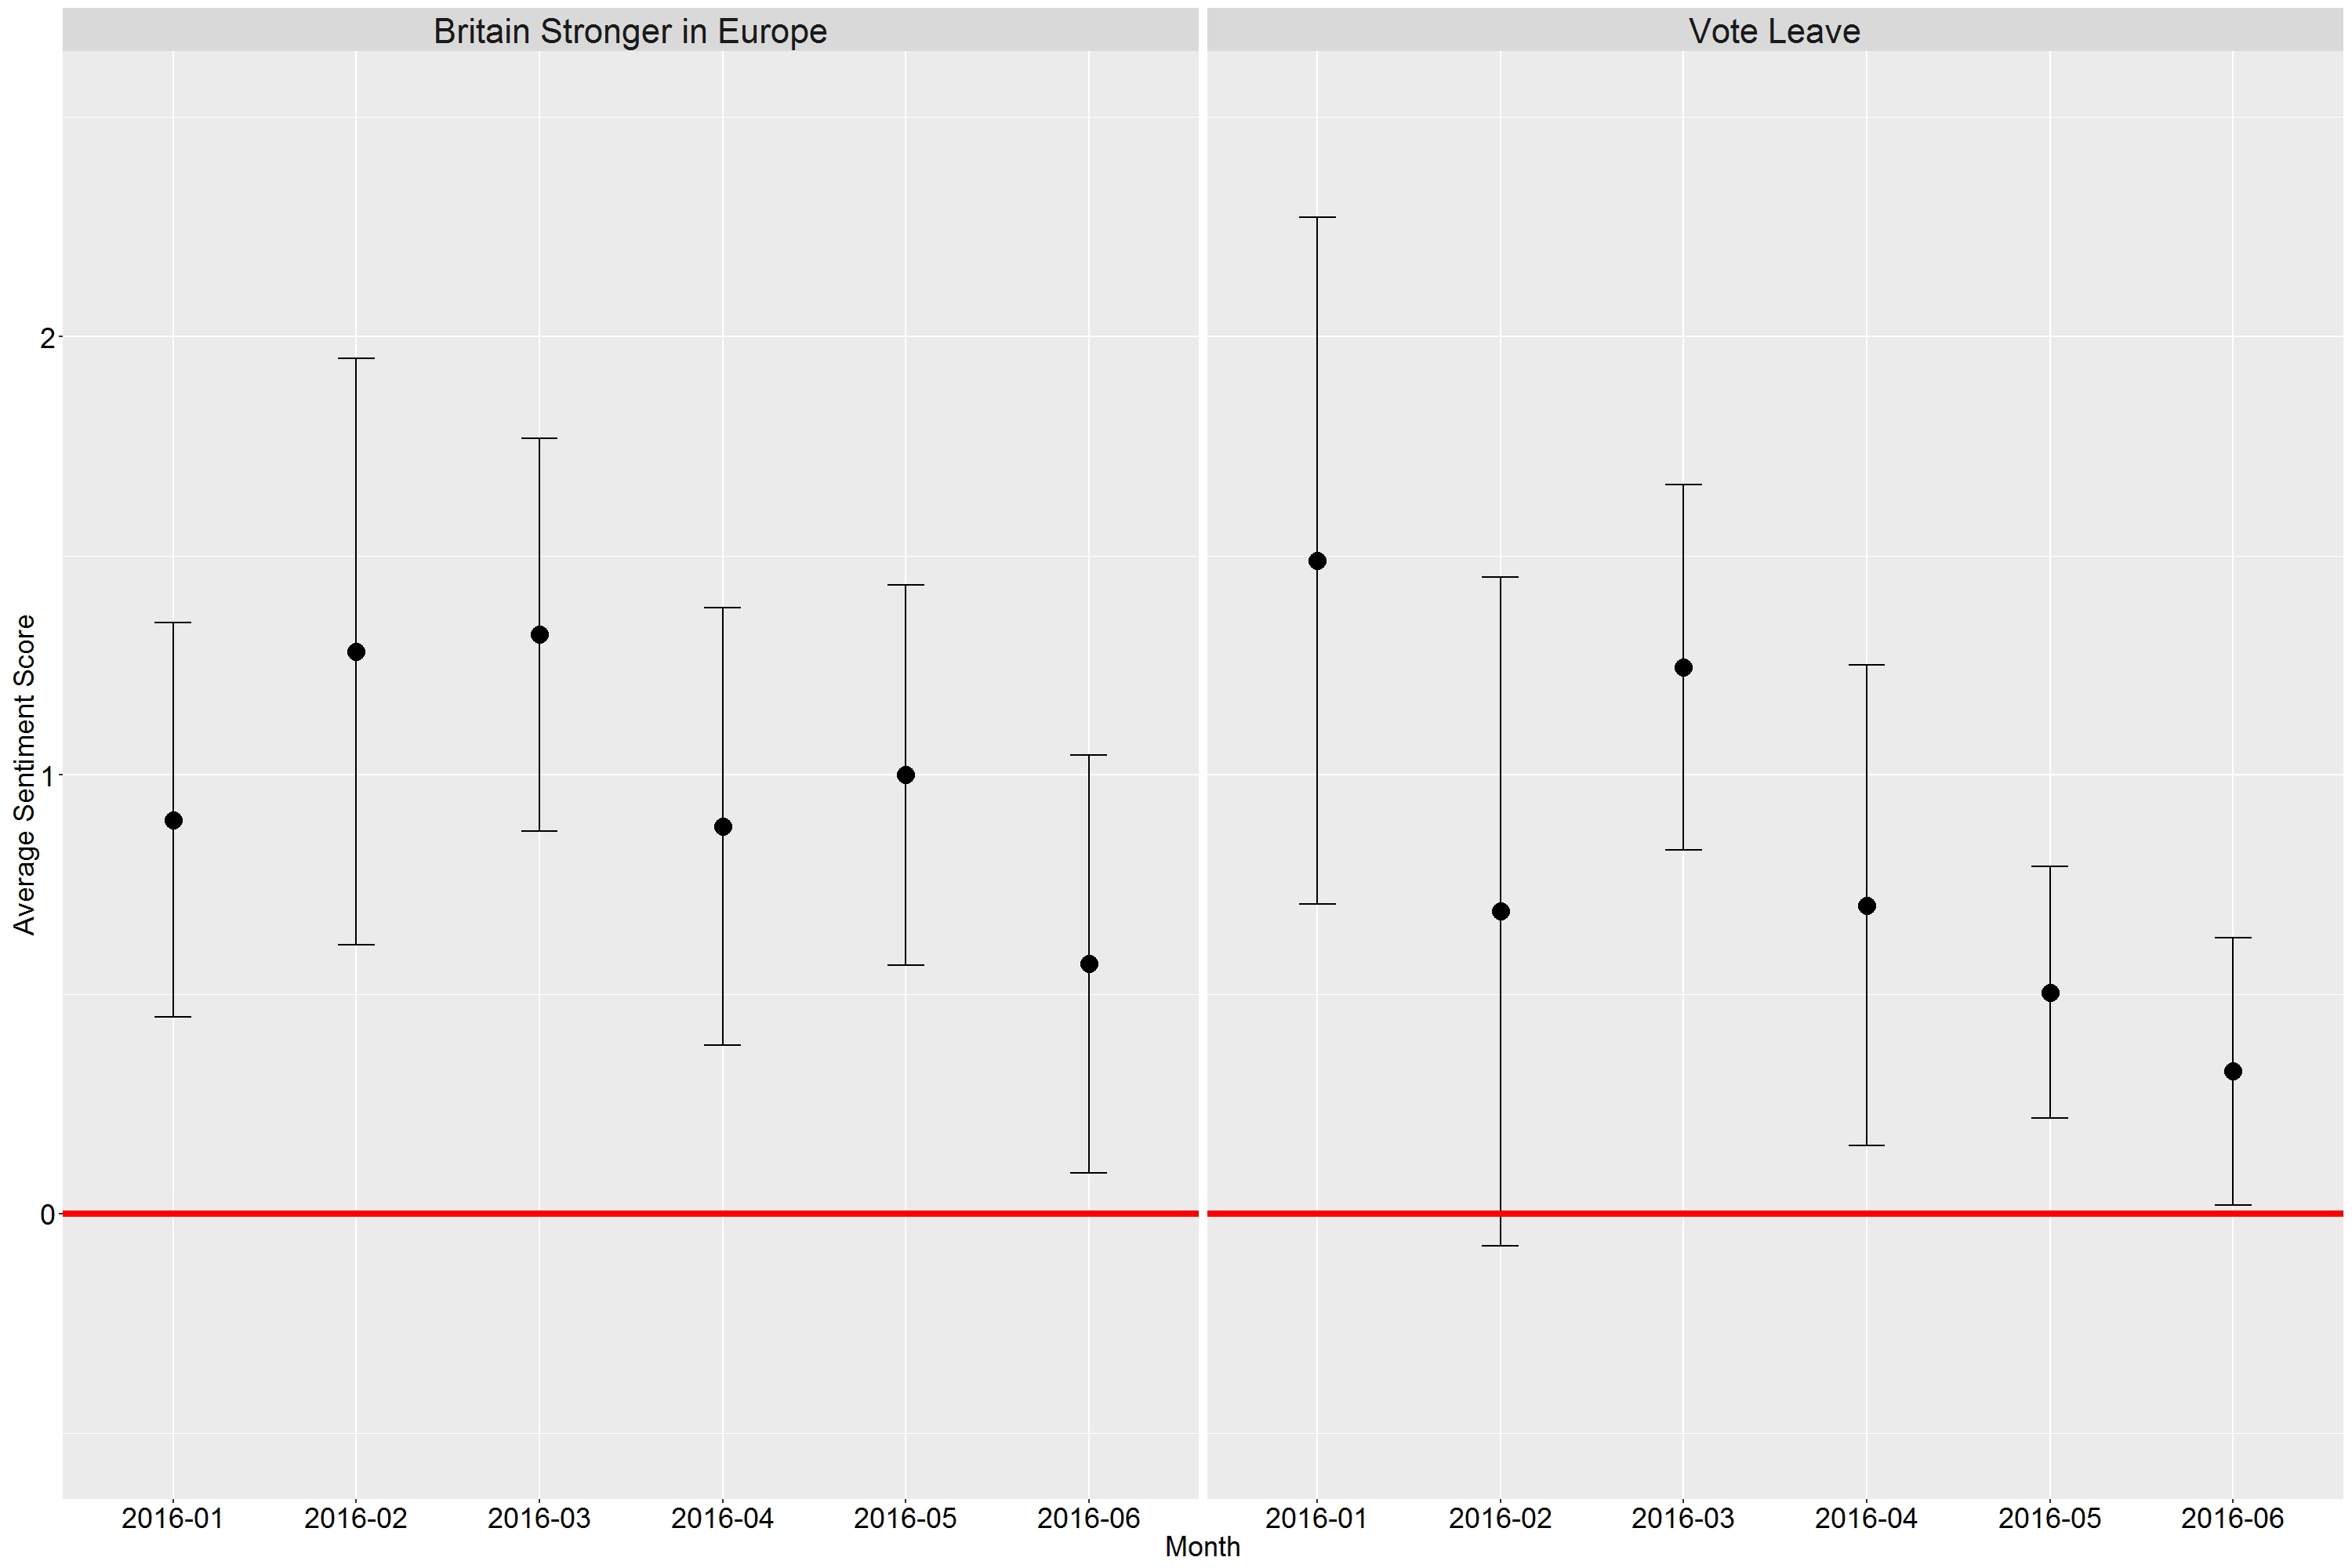
Figure 4. The change in the sentiment score over time for the text data posted on the Britain Stronger in Europe and the Vote Leave Facebook pages since the beginning of 2016. The monthly mean sentiment score is given, together with plus and minus two standard errors
It seems that the Vote Leave campaign and their followers have been more active in disseminating their posts, but recently less positive in the language that they are using to express their opinions than the Britain Stronger in Europe campaign. These characteristics may be naturally expected from an organization campaigning for a fundamental change to the status quo, compared with one that wishes to preserve it.
In summary, our analyses show that large amounts of unstructured publicly available social media data can be condensed into useful and meaningful conclusions.
-
Julian Stander, Luciana Dalla Valle and John Eales are members of the Centre for Mathematical Sciences, Plymouth University, where Andrea Baldino worked in 2015 supported by the Erasmus+Traineeships Programme. Julian Stander is associate professor (reader) in mathematics and statistics, Luciana Dalla Valle is lecturer in statistics and John Eales is associate head for teaching and learning in the School of Computing, Electronics and Mathematics. Mario Cortina Borja is chairman of the Significance editorial board, and professor of biostatistics in the Population, Policy and Practice Programme, UCL Institute of Child Health.
References
- Wheeler, B. And Hunt, A. (2016) The UK’s EU referendum: All you need to know.
- Britain Stronger in Europe
- Vote Leave
- R Core Team (2016). R: A Language and Environment for Statistical Computing. R Foundation for Statistical Computing, Vienna, Austria.
- https://select-statistics.co.uk/blog/using-twitter-to-measure-the-impact-of-your-marketing-campaigns/
- http://davetang.org/muse/2013/04/06/using-the-r_twitter-package/
- http://www.r-bloggers.com/create-twitter-wordcloud-with-sentiments/
- https://www.credera.com/blog/business-intelligence/twitter-analytics-using-r-part-2-create-word-cloud/
- Barbera, P. and Piccirilli, M. (2016). Rfacebook: Access to Facebook API via R. R package version 0.6.3.
- Wickham, H. (2009). ggplot2: Elegant Graphics for Data Analysis. Springer-Verlag New York.
- Wickham, H. (2015). stringr: Simple, consistent wrappers for common string operations. R package version 1.0.0.
- Feinerer, I. and Hornik, K. (2015). tm: Text Mining Package. R package version 0.6-2.
- Fellows, I. (2014). wordcloud: Word Clouds. R package version 2.5.
- Liu, B., Hu, M. and Cheng, J. (2005). Opinion Observer: Analyzing and Comparing Opinions on the Web. Proceedings of the 14th International World Wide Web conference (WWW-2005), May 10–14, 2005, Chiba, Japan.


