
If you compare them with traditional slot machines found in pubs and clubs, which tend to have a maximum stake of no more than £2, it’s a considerable difference. Critics have also highlighted the theoretical possibility of losing up to £18,000 per hour on these machines and this figure has been used to argue that stake sizes should be cut. However, the £18,000 per hour figure is an aberration of the statistics.
This assumes that a maximum stake of £100 is placed every 20 seconds and all money staked is lost. In reality, this doesn’t happen because not all bets placed are losing bets, and overall these machines are programmed to return 97% of the cash they take to players as prize money.
But, this return to player figure needs to be viewed with caution. It’s calculated as an average over a long time frame – around 10,000 bets. Many players incorrectly assume that the 97% return to player means that they will only lose 3p in the pound and that it applies to their single session of play, rather than a longer time frame1. It’s a clear example of the general public misunderstanding statistics, probabilities and short term and long run events.
Making sense of gaming machine data
To help investigate these issues, five of the major bookmakers in Britain (William Hill, Ladbrokes, Coral, Paddy Power and BetFred) gave access to their machine data to a team of researchers from NatCen Social Research and Featurespace.
The machines in bookmakers are all server based which records in real time every bet placed on the machine and the outcome of that bet. Between September 2013 and June 2014, 6.7 billion individual bets were placed on machines in the five major bookmakers in Britain, that’s around 25 million bets per day.
The challenge of analysing this data is how to turn this wealth of transactional information into something meaningful. The way we chose to look at this was to split the data into sessions of play. So we applied an algorithm to the data to identify when it was most likely that a new session of play started and then stopped. This relied on factors such as the machine having been dormant for a period of time, the machine having a zero balance and cash being inserted into the machine and so on.
Of course, as with any algorithm, there is a margin of error and we estimate that we identified around 90% of sessions correctly. Applying this to the transactional data meant we identified around 178 million discreet sessions of machine play between September 2013 and June 2014.
Patterns of play
Once the data was split into sessions we could then investigate what happens within a session of machine gambling. On average, players lost £7 per gambling session. But this masked a wide and varied distribution, with the maximum loss in a single session being over £13,000. It took this person over 7 hours of continuous machine gambling to lose this much money, highlighting the fallacy of the £18,000 per hour estimate. But, this also shows that it is possible to lose a great deal of money in a single session.
At the other end of the spectrum, there was one session of play where someone won over £13,000 pounds – again highlighting the range and diversity of outcomes that can be experienced in single sessions of play.
However, as the graph below shows, the most common outcome was that people would lose their money. Between 70%-80% of sessions resulted in a net loss to the gambler.
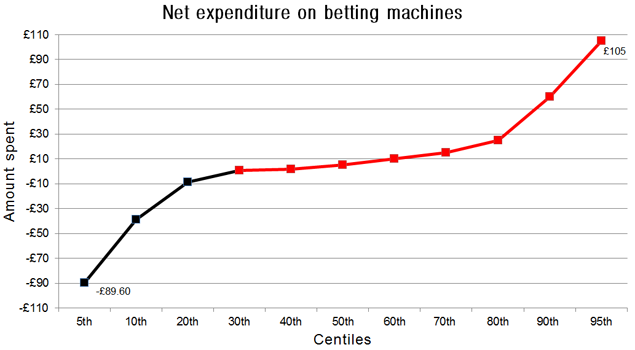
The trend line shows 70% – 80% of sessions ended in a loss (the red line) with 20% – 30% awarding winnings (the black line in the minus end of the scale) to the gambler. Base: all machine data.
The analysis also highlighted other interesting patterns about how people actually play on these machines. On average, sessions were fairly short, lasting only 11 minutes. But, as shown above, there are some people who gamble for a considerably longer time than this. The average stake on a machine was around £5. Placing a bet of £100 was quite rare with just 3% of sessions including a stake of this size. But that still means there were nearly five million gambling sessions between September 2013 and June 2014 which included a single £100 bet on machines.
Identifying problem gamblers?
The downside of using this transactional data is that it only tells us about single sessions of gambling and nothing about people. It’s well known that very engaged gamblers can have more than one gambling session per day, even playing different machines at the same time2. Therefore, to make this data really useful analytically, it needs to be matched to individuals.
At the moment, this can only be done where gamblers have a loyalty card and use that card when gambling on machines. This identifies the session of play to the individual. The problem with this is that uptake of loyalty cards is low. Whilst we have attempted to see whether there are distinct patterns of play between different types of gamblers, we’re working with a skewed sub-sample3.
But as the uptake of loyalty cards increases, combined with policy changes aimed at encouraging more card based tracking, the potential to analyse transactional data in a way that might help us distinguish between problem and non-problem gamblers increases. Until then, maybe the best and clearest message to give machine gamblers is this one: ‘If you play this machine, be prepared to lose’.
Footnotes
- 1. Collins, D., Green, S., D’Ardenne, J., Wardle, H., Kaye, S., (2014) Understanding Return to Player messages: findings from user testing. London: Responsible Gambling Trust.
- 2. Excell, D., Bobashev, G., Wardle, H., Gonzalez-Ordonez, D., Whitehead, T., Morris, R., Ruddle, P. (2014). Report 3: Predicting Problem Gambling: Analysis of industry data. London: Responsible Gambling Trust.
- 3. Wardle, H., Excell, D., Ireland, E., Iliac, N., Sharman, S., (2014) Report 2: Identifying problem gambling: findings from a survey of loyalty card customers. London: Responsible Gambling Trust.


