The Marathon is possibly the most well-known athletic event and undoubtedly, the one with the most interesting historic roots and evolution. Unlike any other distance established in athletic competitions its origins are classically legendary. It comes from the story of Pheidippides, a Greek messenger sent first from Athens to Sparta to ask for help against Persian invaders who had landed at Marathon around 490BC. He covered this trip, around 150 miles (253 km), in two days and then ran the approximately 25 miles (40km) from the battlefield in Marathon to Athens. He proclaimed the Greek triumph and immediately fell dead.
Inspired by this, Baron de Coubertin, one of the founders of the modern Olympic Games proposed a long-distance race over 42km for the first modern games in 1896. Fittingly, the first modern Olympic Marathon was won by a Greek runner, Spiridion Louis, in Athens with a time of 2 hours 58 minutes and 50 seconds. The length of the Marathon course was standardised by the International Association of Athletics Federations in May 1921 to 26 miles 385 yards (42.195 km), the distance used in the 1908 Summer Olympics in London.
Data from the Marathon’s best performances and world record series have been extensively studied. In this analysis I apply the model proposed by RL Smith1 to examine the sequence of yearly best performances defined as annual speed maxima2 – as proposed by HJ Grubb3. Speed is the natural scale to compare performance at different distances, as ‘we know that it will take at least twice as long to run twice as far’, so the forecasts presented here may be directly related to other athletic events.
Figure 1 shows the evolution of the best yearly performances between 1921 and 2014 with world records plotted in red – note the non-linearity of the time scale versus speed. There are many interesting historical aspects in this series, among them the apparent linearity of changes in speed after 1970 and the increase of the world record rate after 1988. Both characteristics reflect a steady increase in the numbers of professional runners.
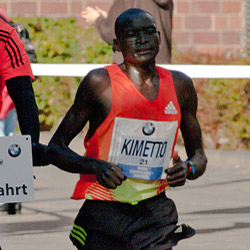
Two further interesting points from the period 1988 to 2014 are firstly the almost complete predominance of African-born athletes holding the world record (the exception being Brazilian runner Ronaldo da Costa in 1998.) Secondly, the importance of the Berlin Marathon for 12 out of the 27 best yearly world performances, including seven out of ten world records.

Figure 1: Best yearly Marathon performances (men) between 1921 and 2014
I will focus on the best yearly performances since 1988 because firstly, in that year the world record was broken by an African athlete (Belayneh Dinsamo) for the first time after Abebe Bikila4, Olympic champion and world record holder in 1960 and 1964.
Secondly, following a nine-year period in which Dinsamo’s record held, there have been 9 out of 17 years in which the world record has been broken signalling a sustained improvement in athletic excellence. Analysing longer series would reduce the standard errors of the model’s estimates but would produce biased predictions as the characteristics of the population of best runners has dramatically changed since 1921, or even since 1970.
Figure 2 shows the 27 yearly best Marathon performances since 1988 – this series includes 10 world records, yielding a record rate of 37%. The blue line corresponds to a linear fit assuming normally distributed errors, which underestimates the world record values. The red line is the trend term fitted with Smith’s model which assumes a parent Gumbel distribution for the best yearly performances and incorporates information on the world record's sequence.
The latter model closely follows the world record values though it should be borne in mind that the model refers to the expected best yearly performances adjusted by the world record series.
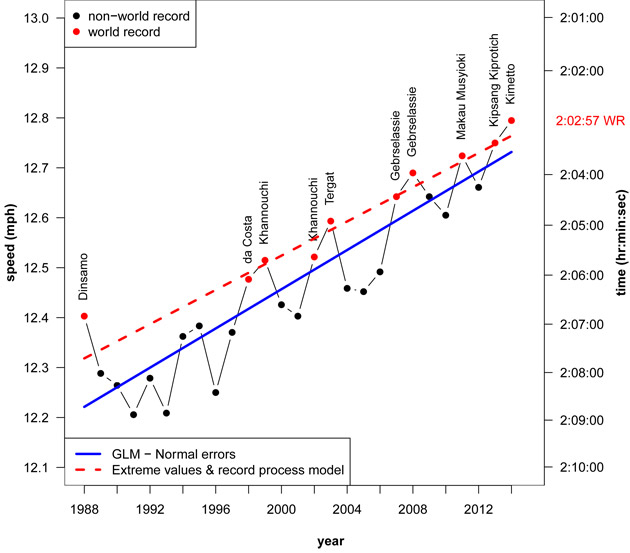
Figure 2: Best yearly performances for Marathon (men’s) 1988-2014 (GLM, and EV and records models)
The following inferences on forecasts for future performances are based on this model. I took advantage of the closed form of the Gumbel’s probability distribution function to estimate specified quantiles of the distribution of the best performance in future years. I did this by simply substituting the maximum likelihood estimates for the fitted-model parameters.
Though long-term forecasts of athletic records are often more science fiction than science, it is interesting to speculate when the men’s Marathon world record will dip below two hours. Figure 3 shows the forecasts for median best performance for the next 30 years and their 95% confidence band5.
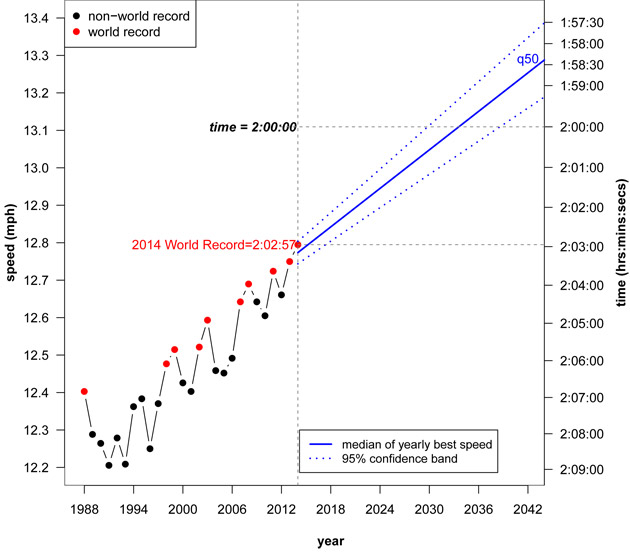
Figure 3: 30-year forecasts for best (censored) yearly performance in Marathon (men’s)
Assuming the current conditions continue in the next years, it is likely that the best annual (censored, in Smith’s model) performance will pass the two hours threshold between 2030 and 2037, thus the (uncensored) world record might reach it a few years earlier – we’ll see!
Footnotes
- 1. Smith RL (1988) Forecasting records using maximum likelihood. Journal of the American Statistical Association, 83, 331-338.
- 2. Note that the sequence of world records is a subset of the annual maxima series. Smith’s model includes a parametric term for performance trend (assumed to be linear in my analysis), and a Type I (Gumbel) extreme value distribution for the annual maxima generating the world record sequence. The data are thought of as analogous to a censored-data problem for the world record sequence: the values of the yearly best performances in non-record years are considered as censored at the observed value. For a linear trend on time, the model has three parameters – two defining it and one dispersion parameter. The model was fitted using the function mle from package stats4 version 3.0.2 in R.
- 3. Grubb HJ (1998) Models for comparing athletic performances. The Statistician, 47, 509-521.
- 4. This Ethiopian athlete was the first sub-Saharan African to win an Olympic gold medal when he broke the world record running the Marathon barefoot in the 1960 Rome Olympic Games. By coincidence, Bikila was born on 7th August 1932, the date of the Olympic Marathon in the Los Angeles Olympic Games.
- 5. Standard errors of these estimates were calculated using the observed variance-covariance matrix of the maximum likelihood estimate via the delta method of propagation of errors (see e.g. Tanner MA (1993) Tools for Statistical Inference (2nd edition), Springer-Verlag, New York) to compute 95% confidence bands for forecasted annual best performances (not world records).


