Other parties, notably the Scottish National Party, Plaid Cymru, the Greens, Respect and the BNP have also played a role in reducing the dominance of Labour and the Conservatives. The chart below shows these changes.
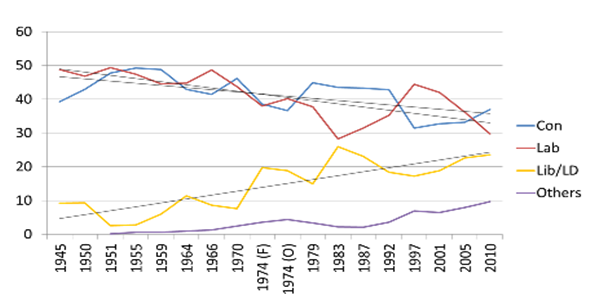
General elections in Great Britain1
As voter pluralism has increased, there have been differential impacts from one part of the country to another. The Conservatives have seen their vote share decline significantly more than Labour in both Scotland and the urban north of England. Similarly, Labour has seen its vote share fall more than the Conservatives in the rural south. The next two charts compare vote shares between 1945 and 2010 in the north (north east and north west) and the south (south east, east and south west).
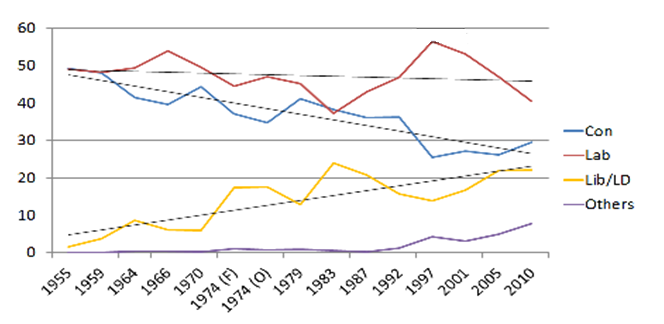
Vote share in the north (north east and north west)1
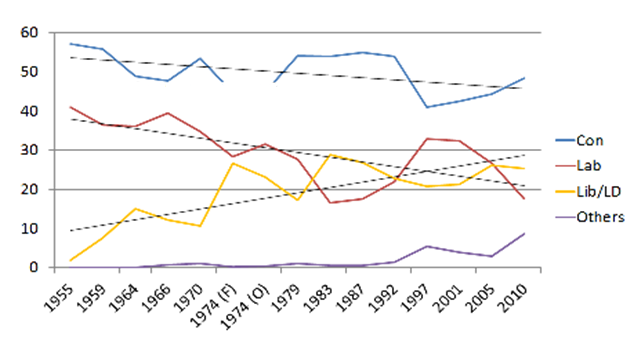
Vote share in the south (excluding London)1
As a result of these voting changes, it has become harder for either the Conservatives or Labour to win a general election outright. The post-2010 coalition was the result of the Conservatives’ failure to win a clear majority. Something similar may happen again in 2015, with either Labour or the Conservatives winning the largest number of seats, but possibly insufficient to form a majority government.
The decline of the Conservatives in the urban north and Scotland has coincided with the long period of de-industrialisation since the 1970s. As recently as 1978, the Tories were well represented on big city councils in the north of England. The table below shows the number of seats held by the major parties on four major northern city councils in 1978 and 2010 (both, within electoral cycles, relatively good years for the Conservatives).
| Conservative decline in northern metropolitan districts2 | |||||
| CON | LAB | LIB/LD | Others | ||
| Manchester | 1978 | 46 | 53 | 0 | 0 |
| 2010 | 0 | 62 | 33 | 1 | |
| Liverpool | 1978 | 24 | 40 | 35 | 0 |
| 2010 | 0 | 48 | 37 | 5 | |
| Newcastle | 1978 | 33 | 40 | 3 | 2 |
| 2010 | 0 | 34 | 42 | 2 | |
| Sheffield | 1978 | 24 | 60 | 6 | 0 |
| 2010 | 0 | 39 | 42 | 3 | |
The Liberal Democrats have been the main beneficiaries of the decline in Conservative fortunes in these major northern cities. They (and in some places others) have also supplanted Labour in a number of southern counties and districts. Again, both dates shown were reasonably good years for Labour.
| Labour decline in southern authorities2 | |||||
| CON | LAB | LIB/LD | Others | ||
| Suffolk | 1981 | 49 | 31 | 0 | 2 |
| 2013 | 39 | 15 | 7 | 14 | |
| Wiltshire | 1981 | 40 | 20 | 12 | 2 |
| 2013 | 58 | 4 | 27 | 9 | |
| Peterborough | 1982 | 21 | 22 | 5 | 0 |
| 2012 | 32 | 12 | 4 | 10 | |
| Colchester | 1980 | 35 | 22 | 0 | 3 |
| 2013 | 23 | 8 | 26 | 3 | |
As parties see their local government strength decline, there appears to be an impact on the capacity to win parliamentary seats. Two examples are given below, one affecting the Conservatives in Liverpool and the other Labour in Eastleigh. In each case, and even allowing for some modest boundary changes, Con-Lab contests have become either Lab-Lib Dem or Con-Lib Dem contests: one of the ‘major’ parties has slipped from being first or second in terms of votes to third or fourth. This pattern is repeated in a significant number of places. Council seats won by each party at the start and finish of the period are also shown.
| Liverpool council seats and General Election vote share3 | |||||
| CON | LAB | LD/All | |||
| Council seats* (1982) | 21 | 42 | 36 | ||
| GE share of vote (%) | |||||
| 1983 | 37.9 | 46.6 | 15.5 | ||
| 1987 | 29.9 | 53.5 | 22.4 | ||
| 1992 | 26.9 | 57.1 | 13.3 | ||
| 1997 | 15.7 | 61.3 | 19.0 | ||
| 2001 | 15.5 | 61.4 | 23.1 | ||
| 2005 | 9.8 | 54.0 | 33.5 | ||
| Council seats* (2008) | 0 | 39 | 45 | ||
| Eastleigh council seats and General Election vote share4 | |||||
| CON | LAB | LD/All | |||
| Council seats* (1973) | 13 | 20 | 5 | ||
| GE share of vote (%) | |||||
| 1955 | 50.7 | 49.3 | n/a | ||
| 1966 | 45.4 | 44.1 | 10.5 | ||
| 1997 | 35.1 | 26.8 | 33.7 | ||
| 2001 | 34.3 | 21.9 | 40.7 | ||
| 2005 | 37.5 | 20.6 | 38.6 | ||
| 2010 | 39.3 | 9.6 | 46.5 | ||
| Council seats* (2012) | 4 | 39 | 40 | ||
There are substantial areas of the country where the major traditional parties’ vote share has declined precipitously since the 1970s. Unless the major parties can re-establish themselves in these places and with lost voters (in all areas) they are less and less likely to be able to win an election outright and could, potentially, be overhauled by an insurgent party.
During the Liberal Democrats’ period in government since 2010, their ‘protest’ vote status has been much reduced. This decline begs the question of where Liberal Democrat votes will go if the party’s share declines permanently to below its pre-2010 level. Looking ahead, it will be interesting to see whether UKIP can win (1) protest; (2) former Conservative and (3) ‘working class’ Labour votes.
For the Conservatives and Labour, there remains a key challenge: how to re-connect with their ex-voters and in places where decline has occurred. Alternatively, it is possible Labour and the Conservatives will continue to suffer attrition and face the prospect of simply becoming one of a larger number of ‘major minority’ parties.
This article first appeared on the LSE Politics & Policy blog under the original title of 'Declining support for the Conservatives in the North and Labour in the South means outright majorities will be less and less likely'
Footnotes
- 1. Derived from statistics in [1] British Electoral Facts 1832-1999, by C. Rallings & M. Thrasher; [2] House of Commons Library
- 2. [1] Local Elections in Britain: A Statistical Digest. C. Rallings & M Thrasher; [2] BBC
- 3. *Liverpool: whole council
- 4. *Eastleigh: whole council


